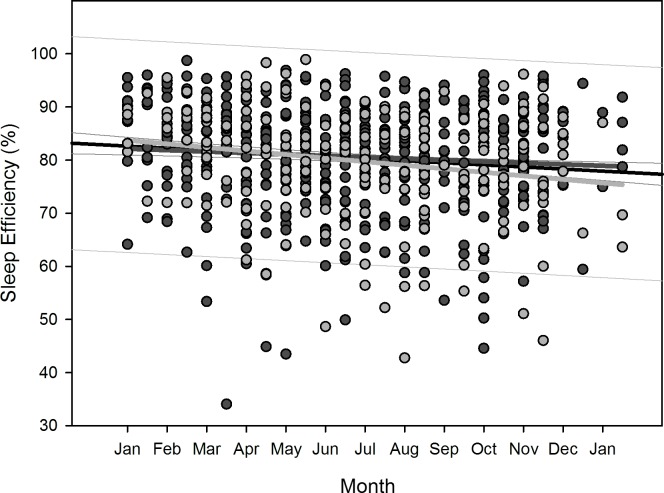
Fig 3. Scatterplot sleep efficiency over overwintering time – 1st order regression.
Changes in sleep efficiency as function of overwintering time, scatterplot and 1st order regression for all participants (black regression line with confidence and prediction intervals extended to axis) and separate for male (dark grey) and female participants (light grey).

