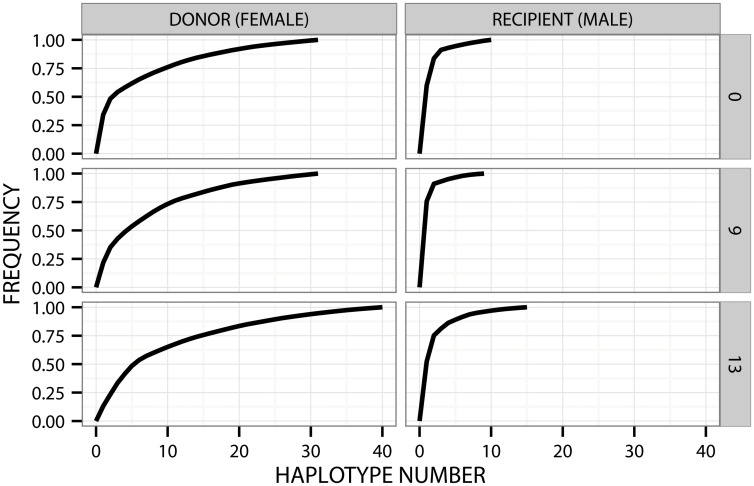
Fig 1. HVR1 quasispecies profile in both spouses at three different time points (0, 9 and 13 months).
On the X axis are the haplotypes ordered by decreasing frequency, while cumulative distribution is shown on Y axis. The flatter the curve, the more complex the quasispecies, with more haplotypes within the population. The male spouse was treated for 6 months with interferon starting immediately after the baseline serum was drawn, but the therapy was ultimately unsuccessful. Presented are haplotypes that had posterior probability > 95% and represent at least 10 reads.

