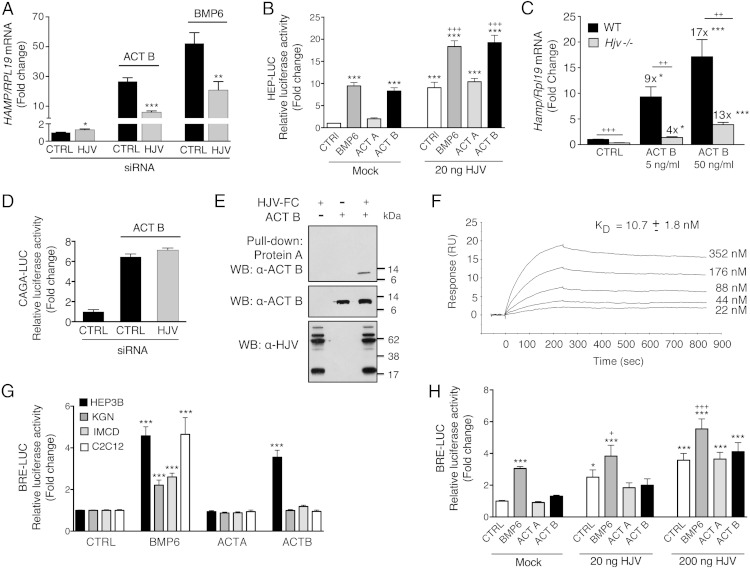
Figure 7.
Activin B (Act B) interacts with the coreceptor HJV to stimulate hepcidin expression in Hep3B cells, but the presence of HJV is not sufficient to enable activin B-SMAD1/5/8 signaling in nonhepatocyte cells. A and D, Hep3B cells were transfected with control siRNA (CTRL) or siHJV (40nM) without (A) or with CAGA-Luc and pRL-TK (D). Forty-eight hours after transfection, cells were incubated in the absence or presence of 5-ng/mL Act B or BMP6 as indicated followed by measurement of HAMP relative to RPL19 mRNA levels by qRT-PCR (A) or relative luciferase activity (D). Data are expressed as the mean ± SEM from 3 separate experiments each performed in triplicate for the fold change relative to untreated control siRNA-transfected cells, which were normalized to 1. Statistical significance was determined by 2-tailed Student's t test for siHJV compared with siCTRL-transfected cells for each treatment condition (*, P < .05; **, P < .01; ***, P < .001). B and H, Hep3B cells (B) or IMCD cells (H) were transfected with Hep-Luc (B) or BRE-Luc (H) and pRL-TK, in combination with empty vector (mock) or the indicated concentrations of cDNA encoding HJV. Forty-eight hours after transfection, cells were treated in the absence (CTRL) or presence of 5-ng/mL BMP6, activin A (Act A), or Act B for 6 hours, followed by measurement of relative luciferase activity. Data are expressed as the mean ± SEM from 2 (H) or 3 (B) separate experiments each performed in triplicate for the fold change relative to mock-transfected untreated cells, which was normalized to 1. Statistical significance was determined by one-way ANOVA with Tukey post hoc test (*, P < .05; ***, P < .001 relative to untreated mock-transfected cells; and +, P < .05; +++, P < .001 relative to untreated HJV-transfected cells at each concentration). C, Primary hepatocytes isolated from Hjv−/− or littermate WT control mice were incubated in the absence or presence of 5- or 50-ng/mL Act B followed by measurement of Hamp relative to Rpl19 mRNA by qRT-PCR. Results are expressed as mean ± SEM from 4 separate experiments each performed in duplicate or triplicate for the fold change compared with untreated WT primary hepatocytes, which was normalized to 1. For Hjv−/− hepatocytes, fold change compared with untreated Hjv−/− hepatocytes is indicated above the relevant columns. Statistical significance was determined by one-way ANOVA with Dunnett's post hoc test compared with untreated cells for each genotype (*, P < .05; **, P < .01,***, P < .001), and by 2-tailed Student's t test for Hjv−/− compared with WT cells for each ligand concentration (++, P < .01; +++, P < .001). E, Purified Act B alone, HJV.Fc alone, or Act B in combination with HJV.Fc was incubated in solution. Act B bound to HJV.Fc was precipitated with protein A beads, and the eluted protein complex was analyzed by SDS-PAGE, followed by immunoblot with activin B antibody (α-Act B) under reducing conditions (upper panel). As a control to demonstrate input proteins, solution aliquots before Protein-A pull-down were also analyzed by immunoblot with anti-HJV antibody (α-HJV) and α-Act B under reducing conditions (lower panels). Representative immunoblots from 1 of 3 separate experiments is shown. F, HJV protein was diluted in running buffer HBS-EP+ into a series of concentrations (22nM, 44nM, 88nM, 176nM, and 352nM) and injected through a CM5 chip immobilized with Act B at 1000 RU. Binding affinity (KD) was measured by SPR. A representative sensogram is shown. The mean KD ± SEM from 3 separate experiments is reported. G, Hep3B, IMCD, C2C12, and KGN cells were transfected with BRE-Luc and pRL-TK. Forty-eight hours after transfection, cells were treated with 5-ng/mL BMP6, Act B, or Act A for 6 hours, followed by measurement of relative luciferase activity. Data are expressed as the mean ± SEM from 3 separate experiments each performed in triplicate for the fold change relative to untreated cells, which were normalized to 1. Statistical significance was determined by one-way ANOVA with Dunnett's post hoc test (***, P < .001 relative to untreated cells).

