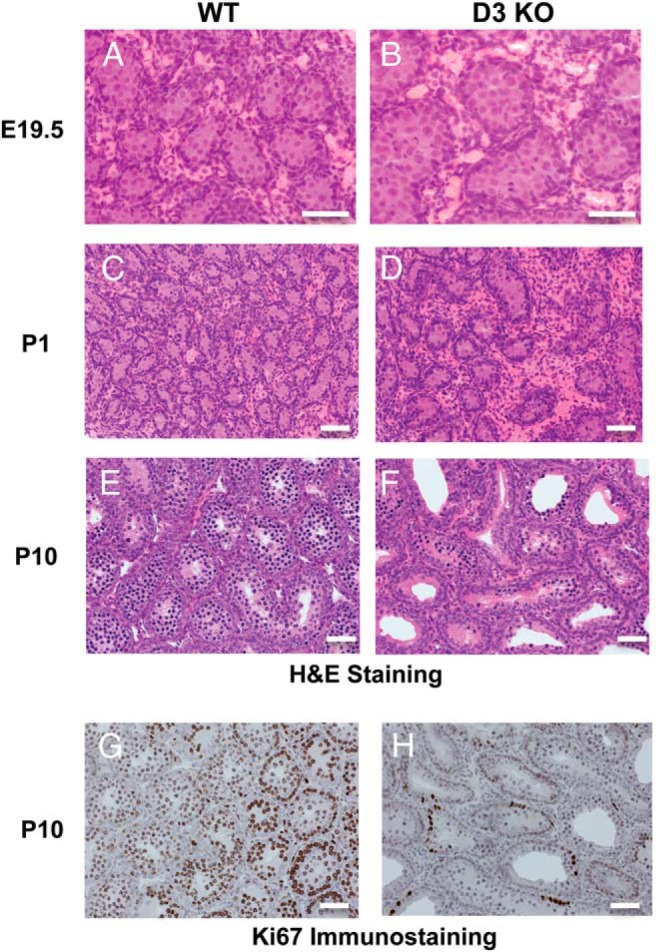
Figure 3.

Neonatal testis histology and cell proliferation. A–F, Representative images of H&E-stained E19.5 (A and B), P1 (C and D), and P10 (E and F) WT and D3KO testis. G and H, Ki67 IHC of WT and D3KO testis at P10. Magnification, ×400 (A and B) and ×200 (C–H). Scale bars, 200 μm.
