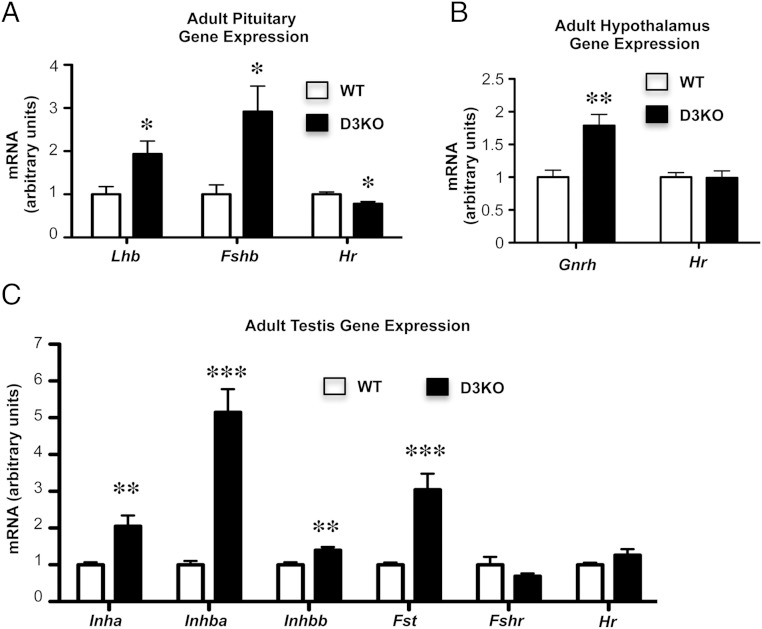
Figure 5.
Gene expression in HPG axis tissues of adult WT and D3KO mice. A, Pituitary expression of Lhb, Fshb, and Hr mRNAs. B, Hypothalamic expression of Gnrh and Hr mRNAs. C, Adult testicular expression of Inha, Inhba, Inhbb, Fst, Fshr, and Hr mRNAs. Data represent the mean ± SEM of determinations in 5–8 mice per group; *, P < .05; **, P < .01; ***, P < .001, as determined by the Student's t test.

