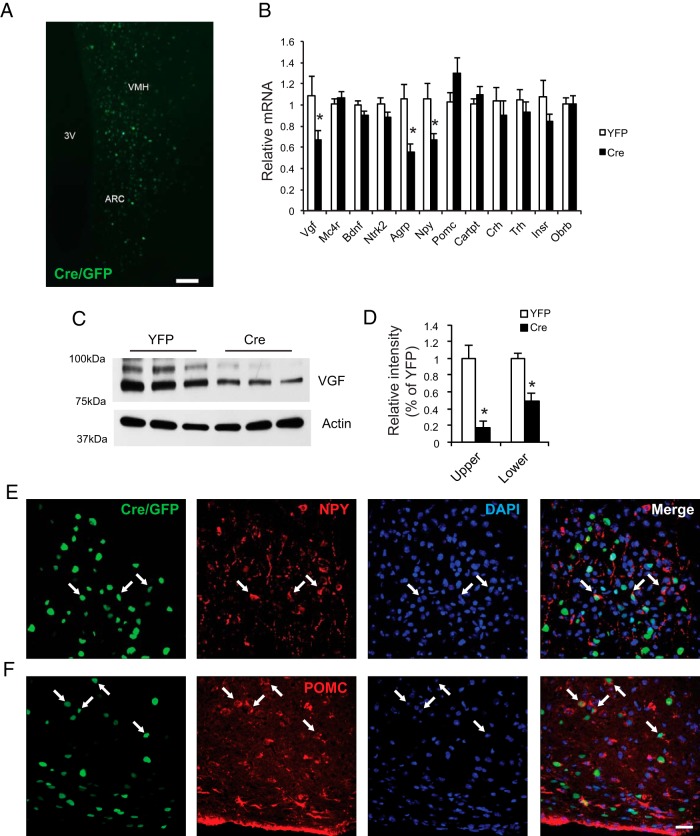
Figure 2.
Hypothalamic-specific knockdown of VGF. A, Representative GFP fluorescence of rAAV-Cre/GFP-injected VGFflpflox/flpflox mice. Scale bar, 100 μm. 3V, third ventricle. B, Gene expression profile of the hypothalamus. n = 8 YFP, n = 9 Cre. C, Western blot analysis of hypothalamic lysates using antibody targeting the carboxy-terminal region of full-length VGF and cleaved peptides. D, Quantification of VGF Western blotting, n = 4 per group. E, Colocalization of Cre/GFP (green) with NPY (red). F, Colocalization of Cre/GFP (green) with POMC (red). Scale bar, 20 μm. Data are mean ± SEM; *, P < .05.

