Figure 3.
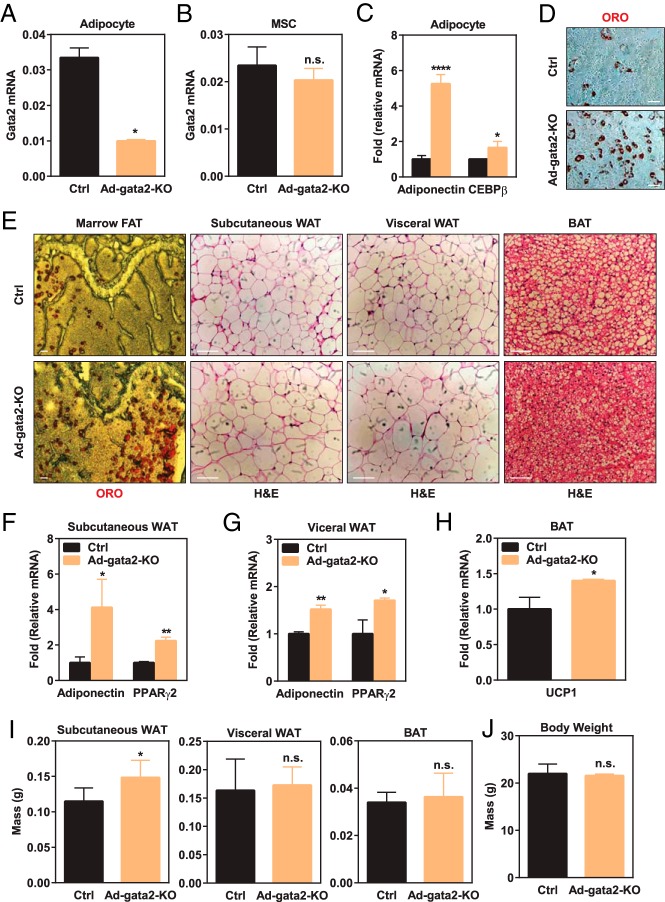
Gata2 in adipocyte lineage suppresses adipogenesis. A and B, Gata2 expression was significantly diminished in adipocytes (A) but not MSCs (B) derived from the bone marrow of Ad-gata2-KO mice (n = 3). C and D, Ex vivo bone marrow adipocyte differentiation was enhanced for Ad-gata2-KO mice compared with littermate controls, shown by the higher expression of adipogenic markers such as adiponectin and CEBPβ (C), and more ORO staining in the differentiation cultures (D) (n = 3). E, Ad-Gata2-KO mice exhibited enhanced adipogenesis in vivo, shown by the more abundant marrow adipocytes and larger adipocytes in subcutaneous and visceral WAT as well as more differentiated BAT. Representative images for ORO or hematoxylin and eosin staining are shown. Scale bars, 25 μm. F and G, Expression of WAT markers such as adiponectin and PPARγ2 was higher in the sc WAT (F) and visceral WAT (G) from Ad-gata2-KO mice compared with controls (n = 3). H, Expression of BAT markers such as UCP1 was higher in the BAT from Ad-gata2-KO mice compared with controls (n = 3). I, Subcutaneous WAT from Ad-gata2-KO mice was heavier compared with controls, whereas visceral WAT and BAT weights were similar (n = 3). J, Body weight was not significantly altered in Ad-gata2-KO mice (n = 3). Ctrl, control. Error bars, SD.

