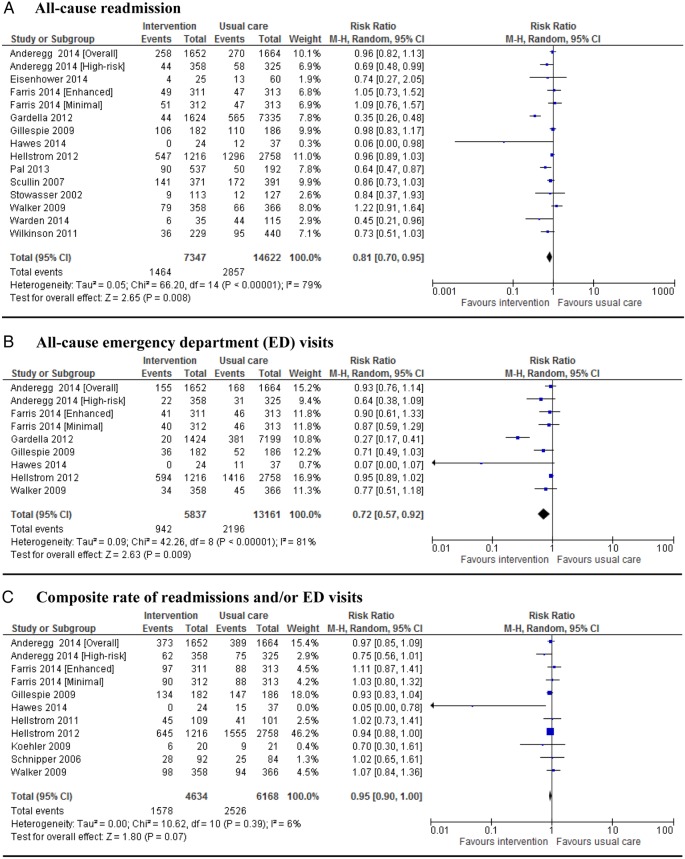
Figure 2.
Forest plots of intervention effects on the proportion of patients with all-cause readmission (A), emergency department (ED) visits (B), composite rate of readmissions and/or ED visits (C), adverse drug event-related hospital revisits (D) and mortality (E). Pooled estimates (diamond) calculated by the Mantel-Haenszel random effects model. Horizontal bars and diamond widths represent 95% CIs. Anderegg et al35 stratified patients into two groups: general population and high-risk patients. Farris et al37 randomised the population into different levels of intervention: minimal and enhanced.

