Fig. 2.

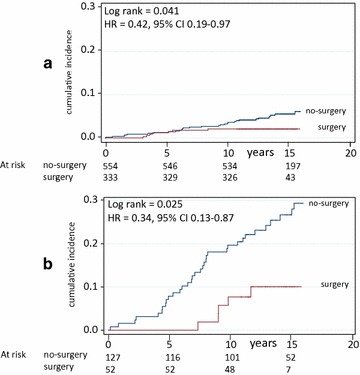
Mortality in surgery and in matched (no-surgery) control patients divided into nondiabetic (a) and diabetic (b) patients. Number of patients at risk is indicated. Years = since visit 1

Mortality in surgery and in matched (no-surgery) control patients divided into nondiabetic (a) and diabetic (b) patients. Number of patients at risk is indicated. Years = since visit 1