
Fig. 6.
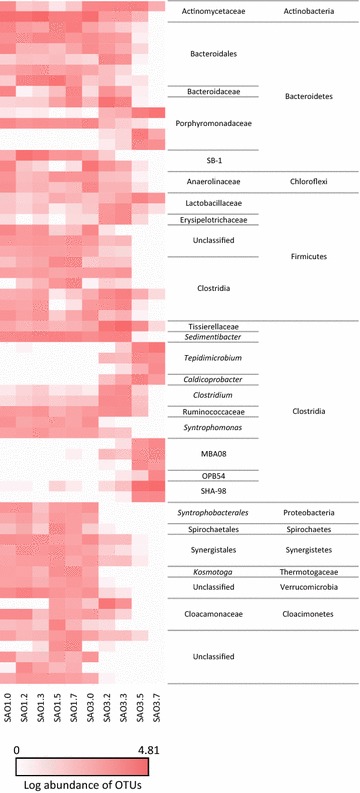
OTU heatmap based on bacterial OTUs having relative abundance higher or equal to 2.5 % with the process SAO1 and SAO3
Official websites use .gov
A
.gov website belongs to an official
government organization in the United States.
Secure .gov websites use HTTPS
A lock (
) or https:// means you've safely
connected to the .gov website. Share sensitive
information only on official, secure websites.
OTU heatmap based on bacterial OTUs having relative abundance higher or equal to 2.5 % with the process SAO1 and SAO3