
Fig. 7.
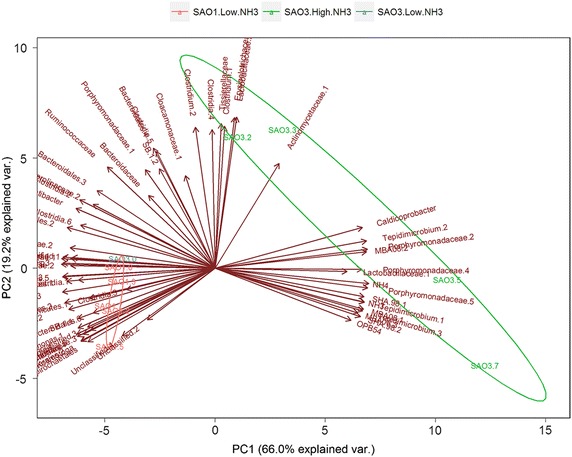
Correlation between bacterial community and the level of ammonium and free ammonia (g/L) within the process illustrated by using principal component analysis (PCA). The dominant bacterial operational taxonomic units (OTUs) that have relative abundance higher or equal to 2.5 % were selected as representative for bacterial community. All variables were centred and scaled before analysis. Results of the first two PCs were present within biplot. Sampling points day 70 (.0), day 141 (.2), day 225 (.3), day 442 (.5), day 642 (.7)