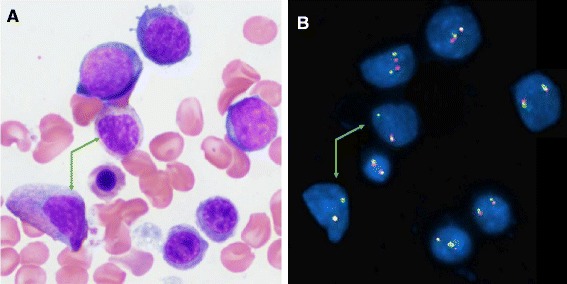
Fig. 3.

Combined morphology and FISH analysis on the same bone marrow slide to further characterize the type(s) of cells carrying the chromosomal aberrations described above. a H.E. staining image (100×) showing all cells morphologically normal; b FISH test using ETV6 BAP probe showing that in the same field as the H.E. staining image, majority of the cells have exhibited two-fusion/yellow signals pattern, except two maturing myelocytes (pointed with green arrows in both a and b) showing one-fusion/yellow, one-green signals pattern, indicating deletion of one copy of the 3′ETV6 (red signal)
