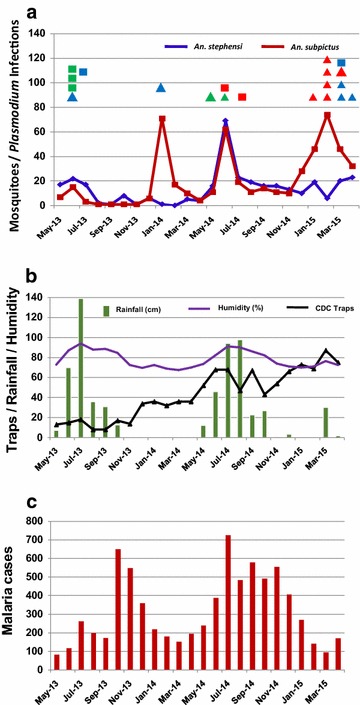
Fig. 1.

Relationship between vector buildup, infected mosquitoes, rainfall in Goa, and numbers of malaria patient cases in Goa. a Anopheles stephensi and Anopheles subpictus prevalence from May 2013 to April 2015 (blue and red lines, respectively) and times of mosquito Plasmodium infections from May 2013 to April 2015 (squares and triangles above the lines). Each spot depicts one Plasmodium infection/mosquito in different months. The colour key is as follows: Blue square: An. stephensi (Pv + Pf), Green square: An. stephensi (Pv), Red square: An. stephensi (Pf), Blue triangle: An. subpictus (Pv + Pf), Green triangle: An. subpictus (Pv), Red triangle: An. subpictus (Pf). b Seasonal variation in traps placed (purple line with triangles), rainfall (green bars), humidity (plain purple line). The scale on the left applies to all three measurements (number of traps, rainfall in cm, and humidity in % value). c Annual distribution of malaria cases at clinics and hospitals in Goa
