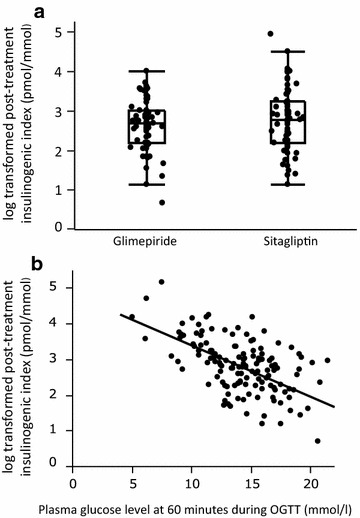
Fig. 2.

a Box and dot plots of log-transformed post-treatment insulinogenic index for glimepiride and sitagliptin groups. Analysis of covariance (ANCOVA) revealed a significantly higher post-treatment insulinogenic index in the sitagliptin group (p = 0.036) in the FAS. b Scatter plot and linear regression equation in total: log post-treatment insulinogenic index (pmol/mmol) = 4.8 − 0.1 × PG at 60 min (mmol/l) (R2, coefficient of determination = 35 %, p < 0.0001)
