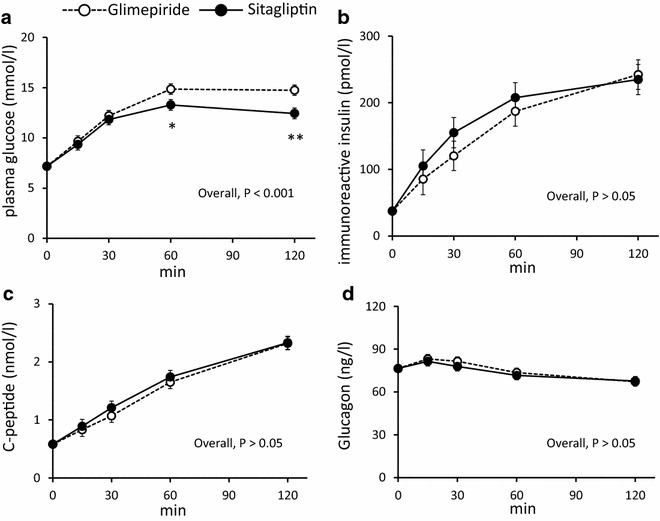
Fig. 3.

The levels of PG (a), IRI (b), CPR (c), and glucagon (d) during OGTT after 52-week treatment. Filled circles with a dotted line: post-glimepiride treatment; filled circles with a solid line: post-sitagliptin treatment. Values show least-squares mean with 95 % confidence interval (CI) estimated by a mixed-model for repeated measures analysis. a p < 0.001 glimepiride vs. sitagliptin, *p < 0.01, ** p < 0.001 vs. glimepiride at each time point. b–d not significant (n.s.) at each time point
