
Fig. 4.
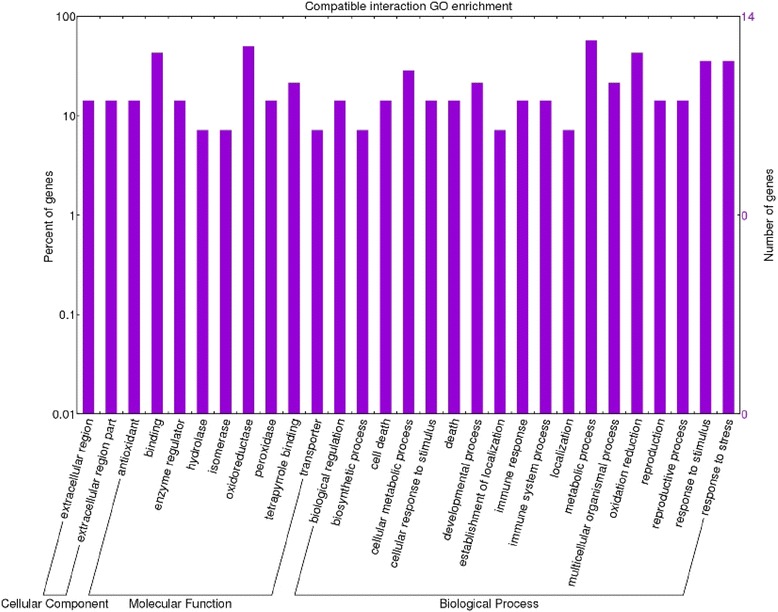
Enriched GO term distribution of the compatible interaction. Functional analysis of the differentially expressed genes in the Monalbo-FORL interaction 15 days post inoculum. The Y-axis indicates the percentage and number of tomato genes in each Gene Ontology (GO) category. X-axis indicates GO categories (Cellular Component; Molecular Function; Biological Process)