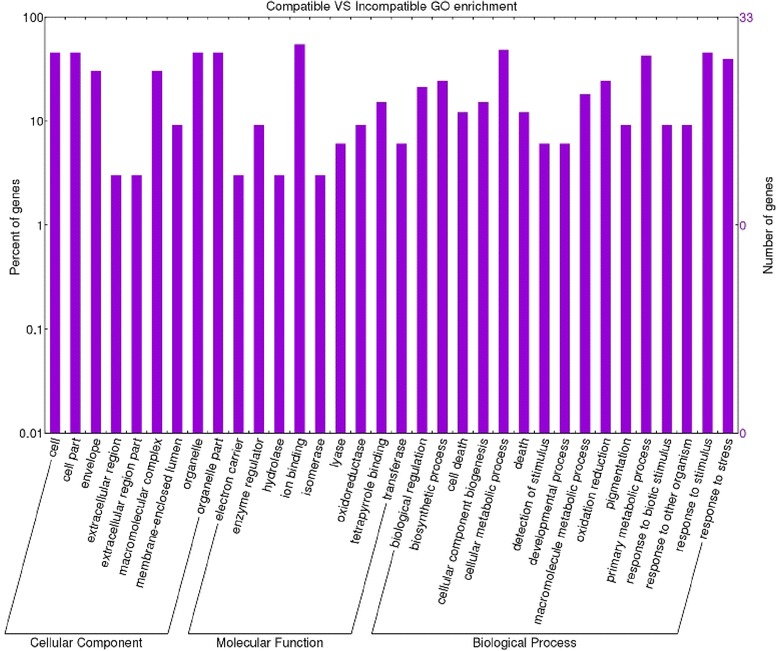
Fig. 5.

Enriched GO term distribution of the comparison between compatible and incompatible interactions. Functional analysis of the differentially expressed genes in the comparison between Momor and Monalbo genotypes inoculated with FORL. The Y-axis indicates the percentage and number of tomato genes in each Gene Ontology (GO) category. X-axis indicates GO categories (Cellular Component; Molecular Function; Biological Process)
