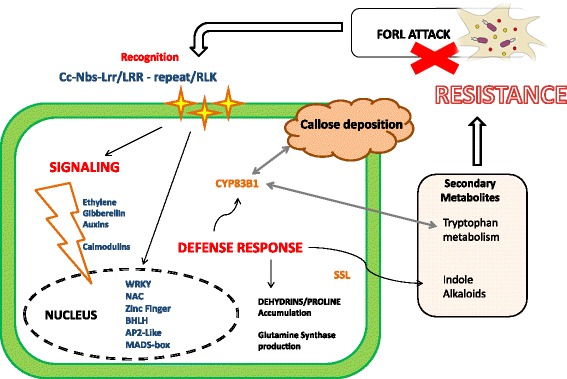
Fig. 6.

Incompatible interaction model. Graphical representation of Momor -FORL interaction at cellular level. Up-regulated resistance proteins are represented with yellow stars and important steps of the reactions in red. Up-regulated DEGs are in blue. Enzymes involved in the defense response are in orange
