Fig. 8.

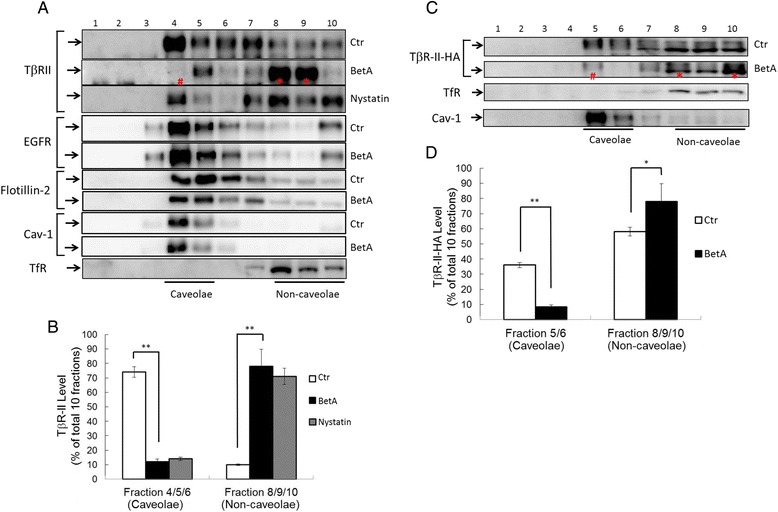
Sucrose density gradient analysis of TβR-II (a, b) and TβR-II-HA (c, d) in the plasma membrane of Mv1Lu cells and Mv1Lu cells transiently transfected with TβR-II-HA plasmid after treatment with BetA. Mv1Lu cells (a, b) or Mv1Lu cells transiently expressing TβR-II-HA (c, d) were pretreated with or without 5 μg/mL of BetA at 37 °C for 4 h. The cell lysates from these treated cells were subjected to sucrose density gradient ultracentrifugation. The sucrose gradient fractions were then analyzed by Western blot analysis using anti-TβR-II, anti-HA probe, anti-EGFR, anti-flotillin-2, anti-TfR-1, and anti-caveolin-1 antibodies. The arrow indicates the locations of TβR-II, TfR-1, and caveolin-1. Fractions 4 and 5 contained lipid rafts/caveolae, whereas fractions 8, 9, and 10 were non-lipid raft fractions. Treatment with BetA alone did not affect the total amounts of TβR-II, TβR-II-HA, and other cell proteins (Additional file 1, Fig. 1). The * symbol indicates the increased amount of TβR-II in the fraction compared with that of the untreated control. The # indicates the decreased amount of TβR-II in the fraction compared with that of the untreated control. BetA treatment induced TβR-II (or TβR-II-HA) translocation from lipid rafts/caveolae to non-lipid raft microdomains. However, BetA treatment did not alter EGFR distribution between lipid rafts/caveolae and non-lipid raft microdomains. The level of TβR-II (a) or TβR-II-HA (c) in lipid rafts/caveolae and non-lipid raft microdomains was determined. The quantitative data from three analyses is shown (b, d) as the mean ± SD (n = 3). *, ** Significantly lower or higher than that in cells treated without BetA (control) (*: P < 0.05, **: P < 0.01) (b, d)
