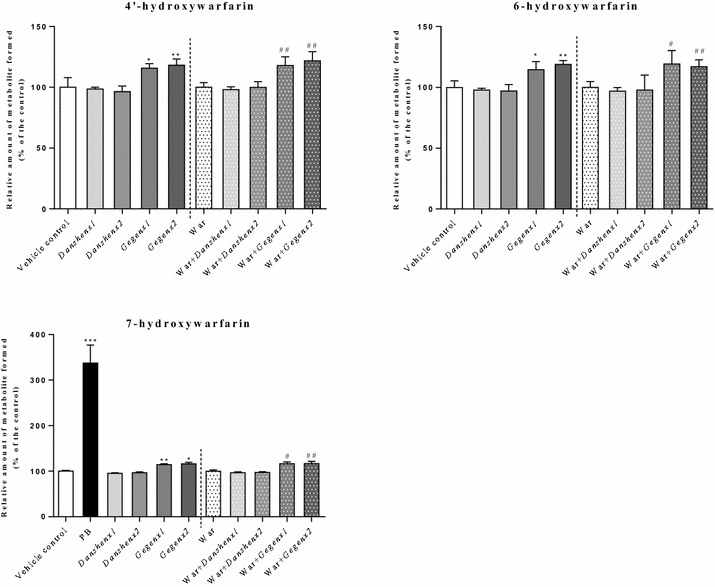
Fig. 2.

Relative amount of formed monohydroxywarfarin (% of control) from different treatment groups. Using S-warfarin as substrate. *P < 0.05; **P < 0.01; ***P < 0.001, compared with the vehicle control group. # P < 0.05; ## P < 0.01; ### P < 0.001, compared with the warfarin alone group. & P < 0.05; && P < 0.01; &&& P < 0.001, compared within same groups of different doses. Each point represents the mean ± SD (n = 6)
