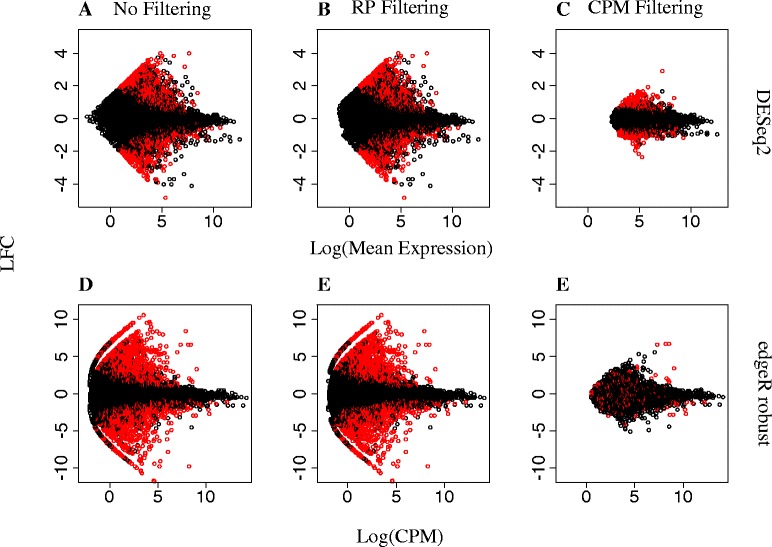
Fig. 2.

MA-Plots for edgeR robust and DESeq2 with and without data filtering. Estimated fold-change in expression of RNA-seq transcripts for SB relative to BB as a function of transcript abundance following differential expression analyses with DESeq2 or edgeR robust (DF = Classic =_edgeR) on data subjected to no filtering (a, d) or to filtering with CPM (c, f) or RP (b, e) methods. For DESeq2, fold-changes are plotted over mean transcript expression on a log scale. For edgeR robust, fold-changes are plotted against counts per million on a log scale. Transcripts declared DE at FDR = 0.05 are colored in red
