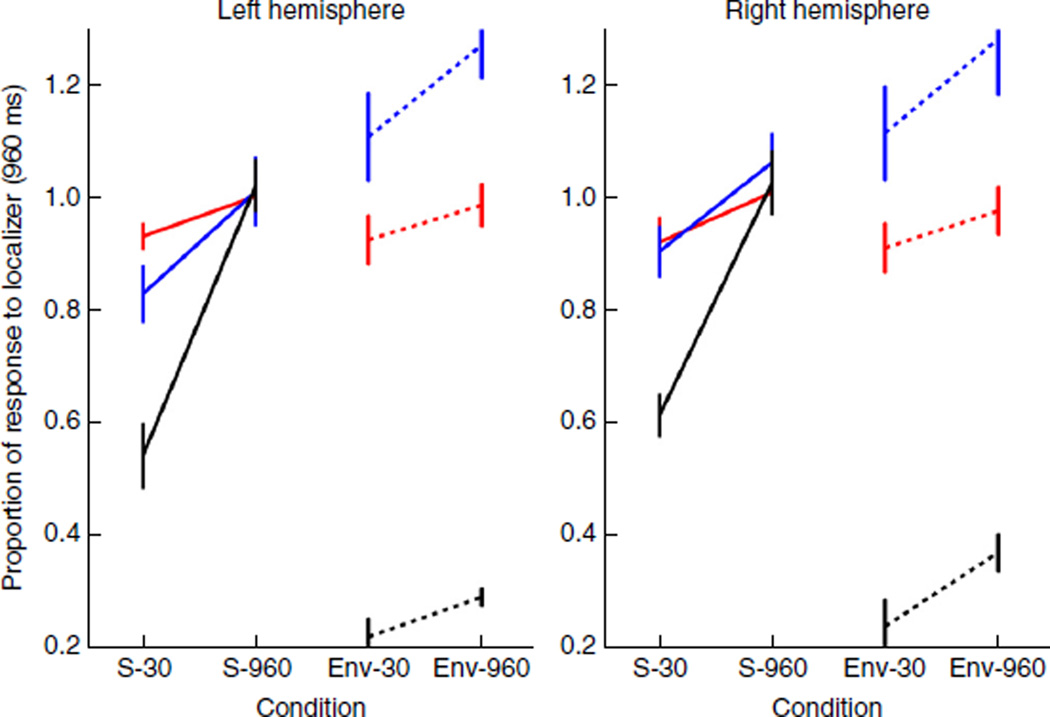
Figure 5.
Responses to environmental sound quilts. Average responses (±s.e.m.) in HG (red), PT (blue) and the individual fROI (black) to speech quilts (solid) and environmental sound quilts (dashed) with segment durations of 30 and 960 ms. Data are averaged across the five participants who were scanned with the environmental sound control condition set.

