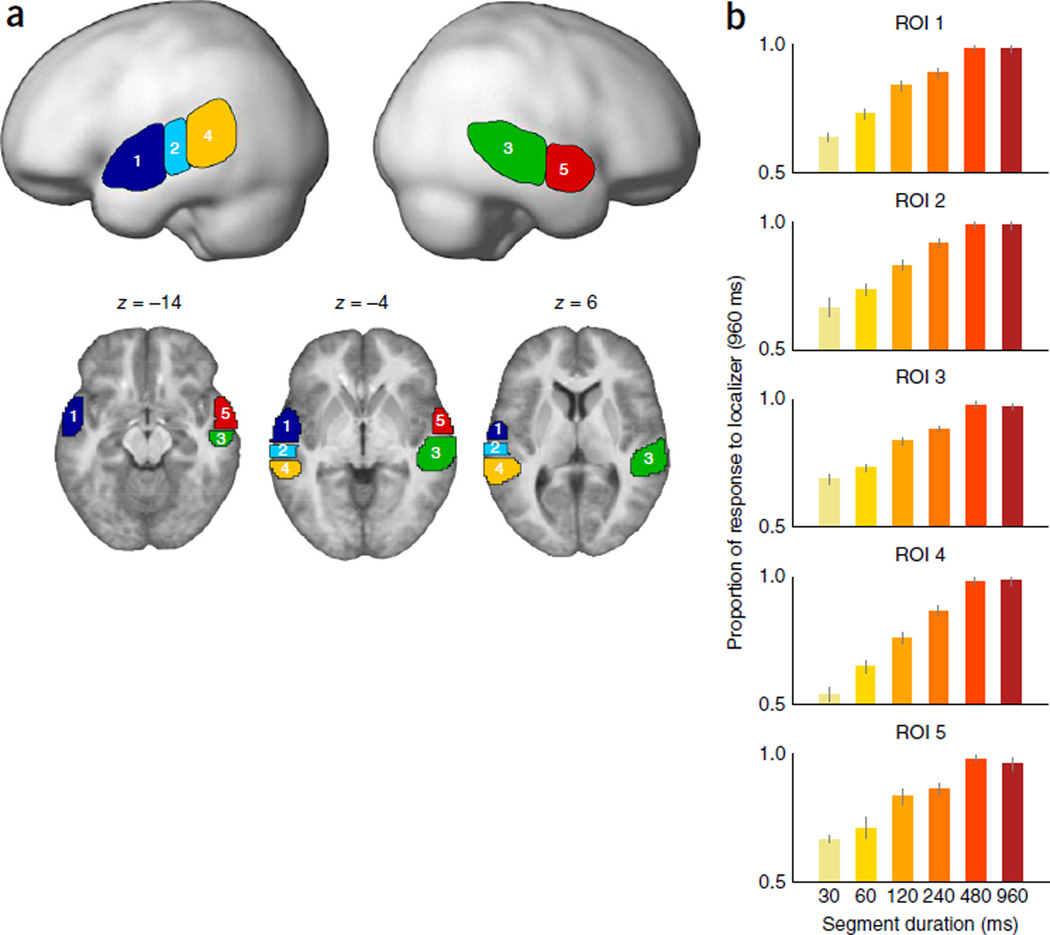
Figure 8.
Functional ROIs revealed by a parcellation algorithm29. (a) The five color-coded fROIs were rendered onto SPM’s smoothed surface template (top) and on individual axial slices (bottom) of our participants’ average structural images. Mean [x, y, z] Montreal Neurological Institute (MNI) voxel coordinates for each parcel were: [−58, −3, −6] (parcel 1); [−61, −22, 0] (parcel 2); [56, −26, −1] (parcel 3); [−59, −37, 6] (parcel 4); [59, 1, −10] (parcel 5). (b) The average response (±s.e.m.) to the six different segment length conditions (normalized with respect to the L960 localizer condition in a parcel) was plotted for each of the five fROIs (n = 15). The response pattern was similar across fROIs.

