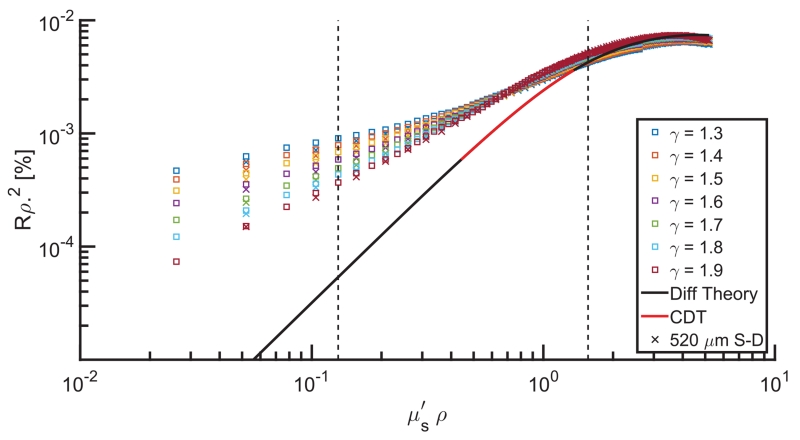
Fig. 1.
Dimensionless reflectance intensity versus dimensionless reduced scattering as returned by MC estimates of multiple γ values (markers) and as estimated by diffusion theory (black line) and CDT (red line). □ represents data collected 260 μm from the source, and x represents data collected 520 μm from the source. Vertical dashed lines bracket the expected range of in tissue (0.5–3 mm−1).

