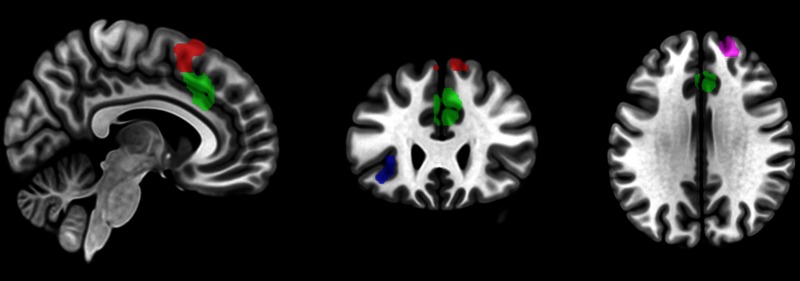
Fig. 2.
Sagittal (x = 6), coronal (y = 27) and axial (z = 31) planes depicting brain activation resulting from the flanker execution task contrast Error > Correct (see fig. S1 for t-score maps). Based on this activation, ROIs were created for the analysis of the agency task and the flanker observation task. Activation clusters in the figure are color coded to represent the different ROIs. The red area represents the dpMFC ROI, the green area represents the vpMFC ROI, the blue area represents the AI ROI, and the purple area represents the LPFC ROI. Note that the vpMFC and dpMFC ROI were created by splitting the pMFC activation cluster in two at the border of the pre-SMA and the RCZ.

