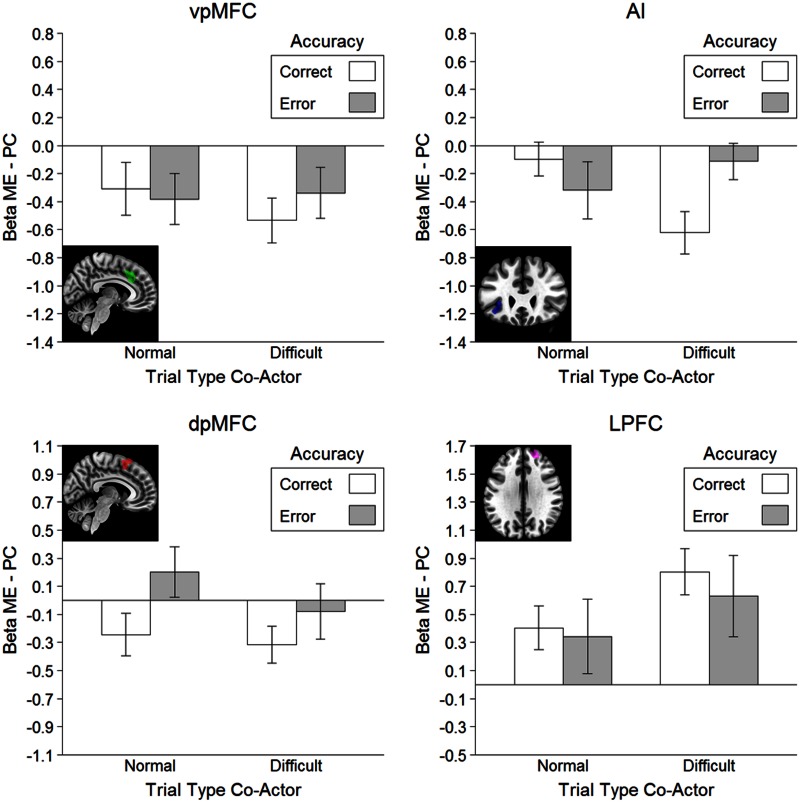
Fig. 4.
Results of the flanker observation task ROI analysis. Each bar represents the difference score between the ME and the PC block (ME–PC) to control for the confounding influence of error likelihood. Error bars represent standard errors of the mean corrected for within subject designs according to Morey (2008). Because the gender distribution was unbalanced, we additionally checked whether the hypothesized pattern in the AI was present for both males and females. A visual analysis confirmed that the same pattern was obtained for both genders (see Supplementary Figure S2).

