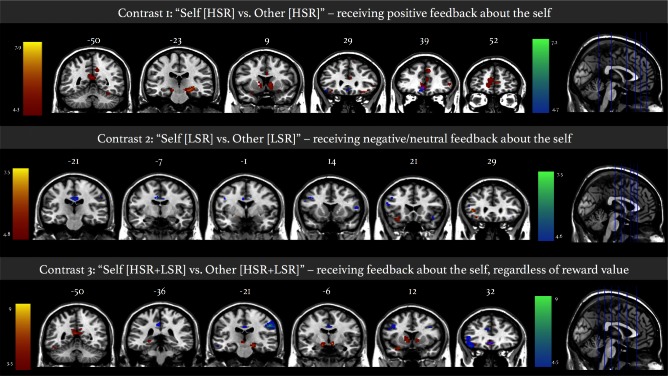
Fig. 3.
fMRI intragroup activation maps. Superposition of activation maps for controls and patients displayed at P < 0.001 with a cluster extent threshold of 80 voxels. Colour bar represents t-scores, where statistical maps are superimposed on the Montreal Neurological Institute template brain. Red-yellow maps correspond to activation in healthy control group. Blue-green maps represent activation in schizophrenia group. Overlapping activation is displayed in pink. Numbers above coronal slices represent y-coordinate. Numbers above axial sections represent x-coordinate. Left side of image corresponds to left side of the brain.

