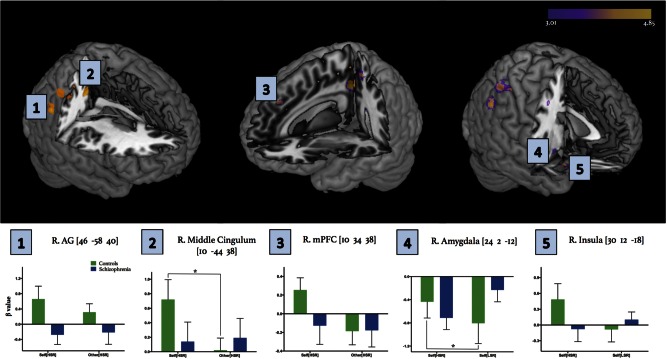
Fig. 4.
Intergroup differences within fMRI activation maps for Self[HSR] vs Other[HSR] and related conditions. Abbreviations. R, right hemisphere; AG, angular gyrus; mPFC, medial prefrontal cortex. Superposition of activation maps directly comparing controls and patients using two thresholds: P < 0.001 and P < 0.005, with a cluster extent threshold of 80 and 120 voxels, respectively. Activations corresponding to the initial conservative P < 0.001 threshold are depicted in yellow, whereas additional activation captured by the more liberal P < 0.005 threshold are depicted in purple. Colour bar represents t-scores, where statistical maps are superimposed on the Montreal Neurological Institute template brain. Selected ROIs are indicated numerically on the activation map panel, with corresponding β values extracted around the peak voxel indicated for each ROI, signifying signal change between patients and controls for separate conditions. Note that β value bar graphs for regions 1-3 compare Self[HSR] and Other[HSR] conditions, whereas regions 4–5 compare Self[HSR] and Self[LSR] conditions due to the latter (i.e. insula and amygdala) having proposed roles in valence/reward processing. Mixed-design ANOVA analyses, with condition as a within subjects factor and group as a between subjects factor, revealed significant interaction effects within the right middle cingulum (F1,28 = 5.067, P = 0.032), amygdala (F1,28 = 2.964, P = 0.0027) and insula (F1,28 = 4.355, P = 0.046). Post hoc analyses revealed a significant difference in β values between conditions for controls within the amygdala and middle cingulum (*P < 0.05), although there was a noteworthy similar trend within the right insula (P = 0.066). Bars represent mean ± SEM.

