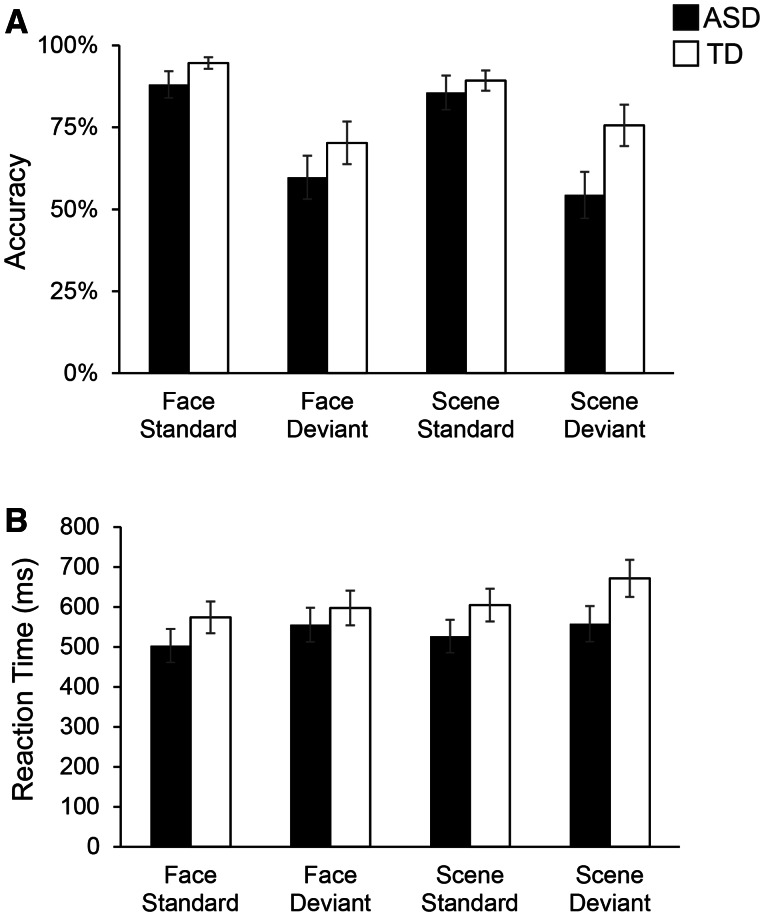
Fig. 2.
Behavioral performance in ASD and TD children on the Faces and Scenes oddball detection task. (A) Average accuracy (i.e. percent correct) for each Group (ASD, TD) and each Condition (Face, Scene and Standard, Deviant) is shown. (B) Average reaction time (ms) is shown for each Group and each Condition.ANOVA results, shown in Table 2, showed no main effect of Group or interaction of Group with Condition. Error bars represent standard errors of the mean. Behavioral performance data missing for three ASD and two TD participants.

