
Fig. 4.
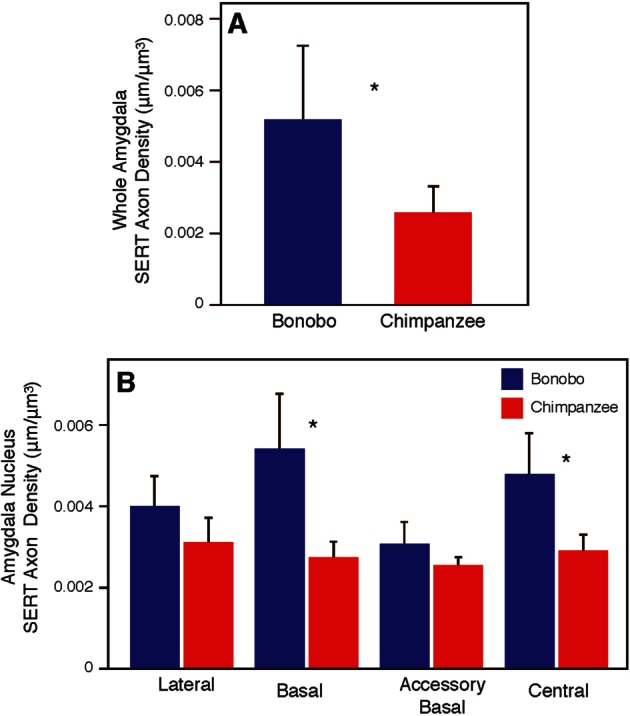
Comparison between bonobos and chimpanzees in SERT-ir axon density in the whole amygdala (A) and amygdala nuclei (B). Asterisks indicate P < 0.05. Error bars represent 95% confidence intervals.
Official websites use .gov
A
.gov website belongs to an official
government organization in the United States.
Secure .gov websites use HTTPS
A lock (
) or https:// means you've safely
connected to the .gov website. Share sensitive
information only on official, secure websites.
Comparison between bonobos and chimpanzees in SERT-ir axon density in the whole amygdala (A) and amygdala nuclei (B). Asterisks indicate P < 0.05. Error bars represent 95% confidence intervals.