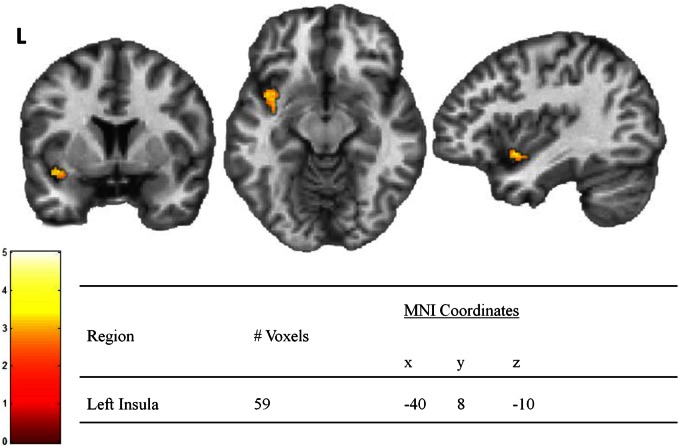
Fig. 3.
Activation for the interaction of group (lean vs obese) and Disgust Sensitivity scores when viewing contaminated foods. Note: Color bar represents T values for activated voxel group at statistical threshold of P < 0.01 and extent threshold = 35 voxels for corrected family wise error (P < 0.01).

