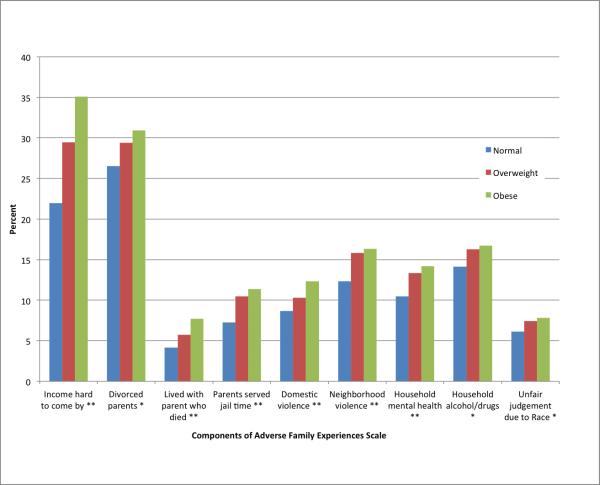
Figure 2.
Distribution of each item on the Adverse Family Experiences scale for children ages 10-17 by child body mass index category from the 2011-2012 National Survey of Children’s Health. Wald χ2 p value for the bivariate association between each AFE component and adolescent BMI category. *p <0.05, ** p< 0.001.

