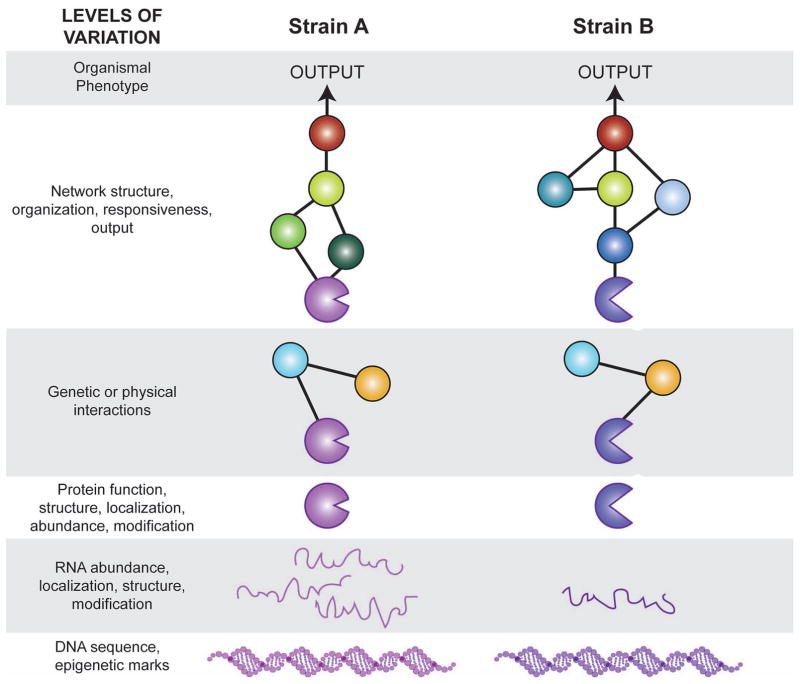
Figure 1. Natural variation at multiple levels.
The diagram depicts natural variation emerging for a given gene and its mRNA/protein product in one strain (left column) and for the orthologous gene and products in a second genetic background (right column). Circles and lines represent proteins and the interactions between them, respectively.

