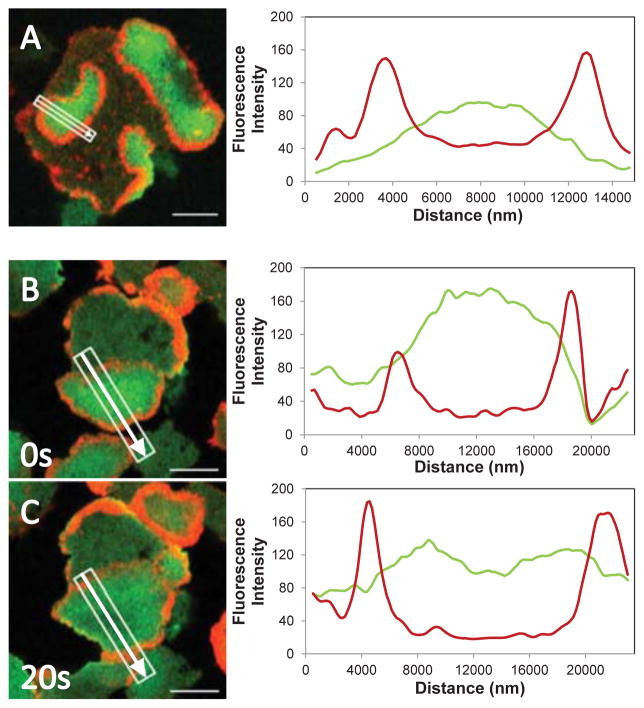
Fig. 12. Linescans of Myo1F and F-actin fluorescence in actin waves.
GFP-Myo1F and RFP-lifeact were coexpressed in Myo1B-null cells and actin waves were induced with 1 μM latrunculin. Merged cell images are shown at the left and line scans of GFP-Myo1F and RFP-lifeact fluorescence are shown at the right. (A) Cell with multiple waves, the Myo1F fluorescence peak is located in the middle of the region encircled by a wave. This image corresponds to supplemental movie M2. (B) and (C) actin wave in the same cell at 0 s and 20 s. During wave expansion Myo1F fluorescence decayed in the middle of the wave. The white rectangle shows the region scanned, the arrow indicates the direction of scanning. Images of live cells are shown. Bars are 10 μm.

