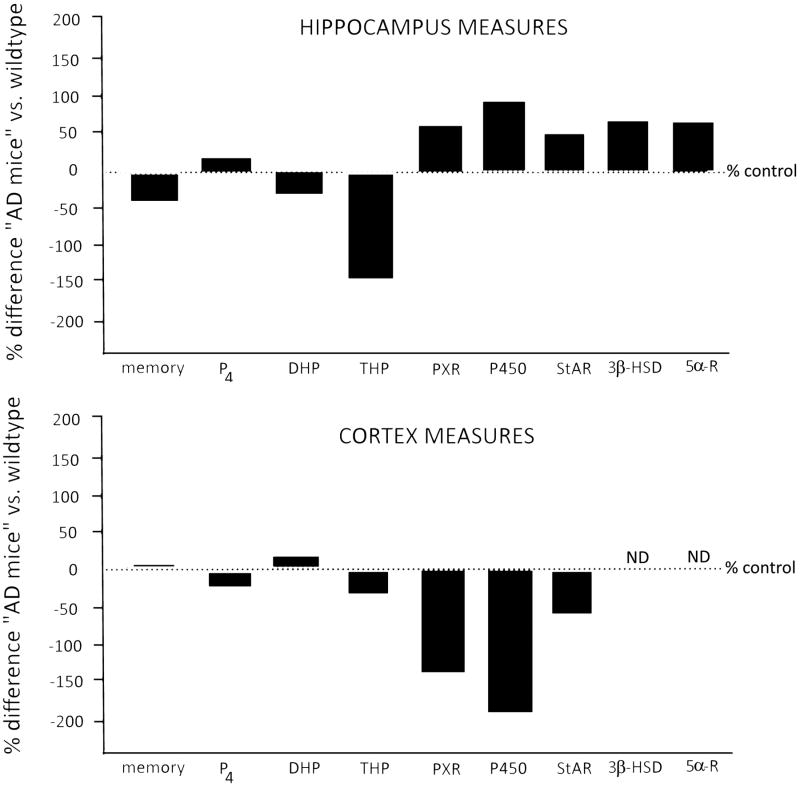
Figure 2.
Figure depicts behaviour, pregnane steroid concentrations, and expression patterns in the hippocampus (top panel) and cortex (bottom panel) for 12 month old transgenic mice that co-overexpress mutant forms of amyloid precursor protein and presenilin 1 Δ exon 9 mutation (APPswe+PSEN1Δe9; a murine model of early-onset familial Alzheimer's disease- AD), compared to their age-matched wild-type controls (n = 4-6). For all measures, mice had data collected at 12 months of age, following 6 months of continuous progesterone (P4) administration via subcutaneously implanted pellets (25 mg, 90-day release at 6 months of age and then 9 months of age; purchased from Innovative Research of America). Behaviour: Performance in a memory task assessing the hippocampus (object placement) and cortex (object recognition) is depicted and based upon comparing the Alzheimer's disease mice to wild-type controls (methods and raw data published in (146)). Pregnane steroid concentrations: Levels of P4, dihydroprogesterone (DHP), and 3α,5α-THP (THP) were measured using radioimmunoassay of dissected out hippocampus and cortex (methods and raw data published in (146)). Protein expression: Expression patterns in hippocampus and cortex were determined by western blotting, of specific proteins (pregnane xenobiotic receptor (PXR), cytochrome P450-dependent side chain cleavage- P450scc, steroidogenic acute regulatory protein- StAR, 3β-hydroxysteroid dehydrogenase- 3β-HSD, and 5α-reductase- 5α-R). The mean of relative intensity (relative density of protein of interest to actin control) in hippocampus and cortex of Alzheimer's disease mice were compared to that determined in wild-type controls. A standard western blotting protocol (146) was employed to assess these factors in hippocampus and prefrontal cortex tissues (a description of tissue collection from animal subjects, brain storage, dissection and preparation is described in (146)). Protein concentration for each sample was determined with a Nanodrop spectrometer. Samples of equal protein concentrations were then prepared for loading on to NuPAGE Bis-Tris Mini Gels (4-12% SDS Polyacrylamide) by combining them with 2.5 μl of NuPAGE LDS (4×) sample buffer, 1 μl of NuPAGE Reducing Agent (10×), 6.5 μl of deionized water (Invitrogen). Electrophoresis was then conducted with running gels with 1× MOPS running buffer with one lane reserved for the protein ladder and one for the positive control (liver homogenate). Protein was then transferred to nitrocellulose using 1× NuPAGE Transfer buffer. The blots were blocked in 5% milk PBS-10% tween solution. All blots were probed with primary antibodies (Ab) at 4°C overnight. Primary (1°) Ab for PXR, P450, StAR, and 5α-reductase were purchased from Santa Cruz Biotechnology; 3β-HSD was received from Dr. Penning, and actin was purchased from Sigma. The secondary (2°) Ab was a Goat Anti-Mouse IG (H+L) Horseradish Peroxidase Conjugate (Bio-rad, Hercules, CA, USA). Concentrations of Ab were: PXR (1° Ab concentration 1:1000; 2° Ab concentration 1:2500); P450 (1° Ab concentration 1:2500; 2° Ab concentration 1:2500); StAR (1° Ab concentration 1:1000; 2° Ab concentration 1:2500); 3β-HSD (1° Ab concentration 1:2500; 2° Ab concentration 1:2500); 5α-reductase (1° Ab concentration 1:1500; 2° Ab concentration 1:2500), actin (1° Ab concentration 1:500; 2° Ab concentration 1:2500). Blots were probed with 2° Ab for 1 hour on a shaker at room temperature (Bio-rad). Results were visualized using DuoLuX Chemiluminescent/Fluorescent Substrate Kit for Peroxidase (Vector Laboratories), imaged on a ChemiDoc XRS (Bio-rad), and analyzed using ImageJ software. Expression was not detected (ND) for 3β-HSD in either group or for 5α-reductase in the wild-type controls, albeit Alzheimer's disease mice showed 2.0 relative intensity. Relative intensity values in the hippocampus (mean ± sem) for PXR (wildtype 0.4 ± 0.2; AD 1.0 ± 0.2), P450 (wildtype 0.3 ± 0.1; AD 1.4 ± 0.3), StAR (wildtype 0.6 ± 0.1; AD 1.0 ± 0.3), 3α-HSD (wildtype 0.4 ± 0.2; AD 0.8 ± 0.5) and 5α-reductase (wildtype 0.5 ± 0.2; AD 1.0 ± 0.7). Relative intensity values in the cortex (mean ± sem) for PXR (wildtype 2.2 ± 1.2; AD 1.0 ± 0.3), P450 (wildtype 1.7 ± 0.8; AD 0.6 ± 0.1), StAR (wildtype 1.4 ± 0.8; AD 0.9 ± 0.2), 3α-HSD (wildtype ND; AD ND) and 5α-reductase (wildtype ND; AD 2.0 ± 1.2).

