
Figure 17. Hsp70 expression under proteasome inhibition.
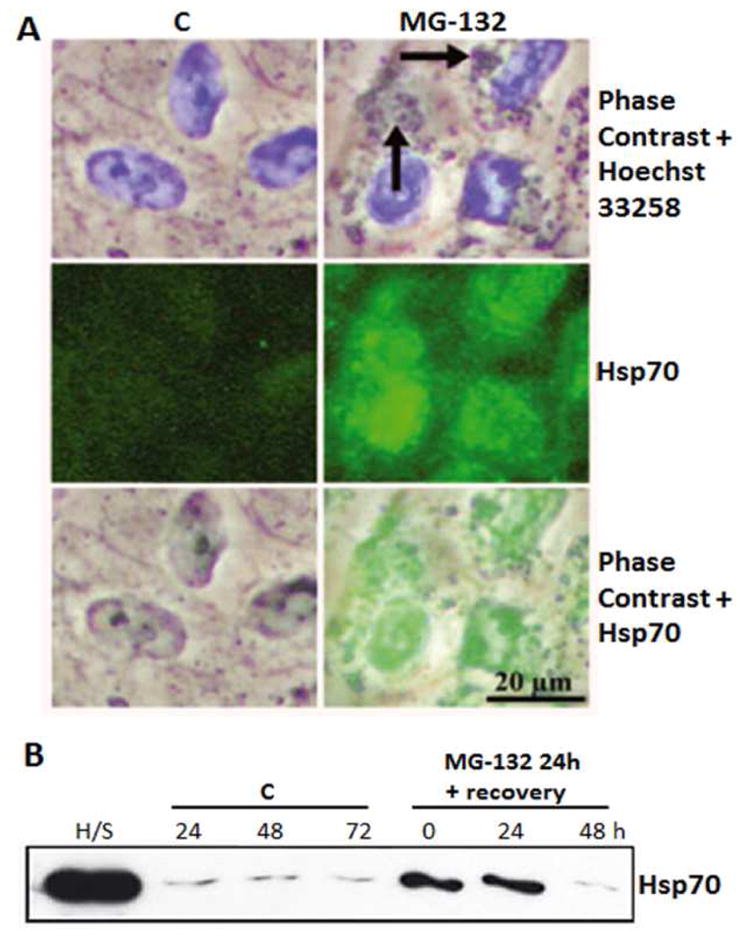
(A) Phase contrast microscopy and immunofluorescence analysis for Hsp70 (green) in control cells, and cells exposed to 10 μM MG-132 proteasome inhibition for 24 hrs. Nuclei were stained with Hoechst 33258 dye (blue). Arrows point to perinuclear protein aggregates. (B) Western blotting analysis (10 μg protein/lane) of the Hsp70 content in isolated lysosome fractions from the control cells (lanes for C) or cells exposed to 10 μM MG-132 for 24hrs (lane 0) or cells exposed to 10 μM MG-132 for 24 and then allowed to recover for up to 48 hrs (lanes 24 and 48). Lysate from heat shocked cells (H/S) are the positive control. Reprinted with permission of Journal of Cellular and Molecular Medicine.