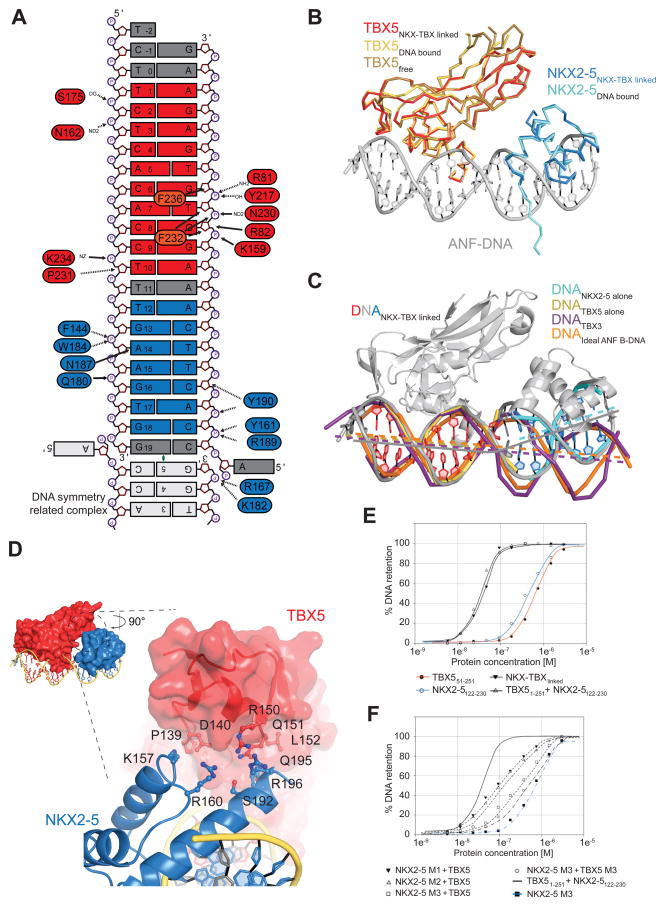
Figure 7. Detailed Analysis of the Interactions between NKX2-5 and TBX5 on Nppa DNA.
(A) Schematic summary of protein-DNA interactions. Only direct contacts between protein and DNA molecules are labeled as no water molecules have been built.
(B) Structures of TBX5TBD bound to DNA (yellow, PDB ID 2X6V) and unbound TBX5TBD (brown; PDB ID 2X6U) superimposed on TBX5TBD from NKX-TBXlinked (red) are shown in ribbon representation. The structure of NKX2-5HD bound to DNA (cyan; PDB ID 3RHQ) superimposed on NKX2-5HD from NKX-TBXlinked are shown in ribbon representation. DNA from the NKX-TBXlinked is shown in cartoon representation (grey).
(C) Structural comparison between DNA molecules from NKX-TBXlinked (red/grey/blue) and individually bound TBX5 (yellow), NKX2-5 (cyan), TBX3 (purple; PDB ID 1H6F), and idealized B-DNA of the Nppa promoter (orange). Lines indicate the central tracks of each individual DNA molecule.
(D) Close-up view of the interface between NKX2-5HD (blue, cartoon) and TBX5TBD (red, surface) highlighting the position of contributing and mutated residues.
(E) Graphs of filter-binding assays using radioactively labeled DNA in combination of different purified proteins (indicated below).
(F) Same as (E) using indicated point mutants. NKX2-5 M1 corresponds to NKX2-5122-230 K157A; NKX2-5 M2 to NKX2-5122-230 Q195A/R196A; NKX2-5 M3 to NKX2-5122-230 K157A/Q195A/R196A; TBX5 M3 to TBX51-251 P139A/D140A/R150A/Q151A.
See also Figure S7.

