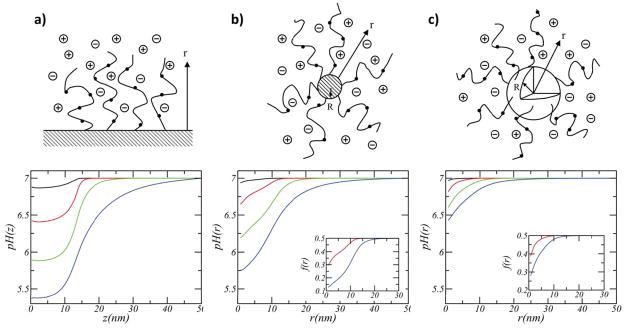
Figure 2.
Variation of pH as a function of the distance from the surface for (a) planar, (b) cylindrical (1nm diameter), and (c) spherical (1nm diameter) NP grafted with weak polyelectrolytes (surface coverage= 0.25 nm 2, polymer chain length= 50, and pKa=7). The colors correspond to different salt concentrations: 1 (black), 0.1 (red), 0.01 (green), and 0.001 M (blue). A concentration of 0.1M is the closest to physiological conditions. The insets show the fraction of charged groups as a function of the distance from the surface. The solution’s bulk pH is 7. Adapted with permission from Nap et al., J. Polym. Sci. B Polym. Phys., 2006, 44, 2638–2662. Copyright 2006 John Wiley & Sons, Inc. 64

