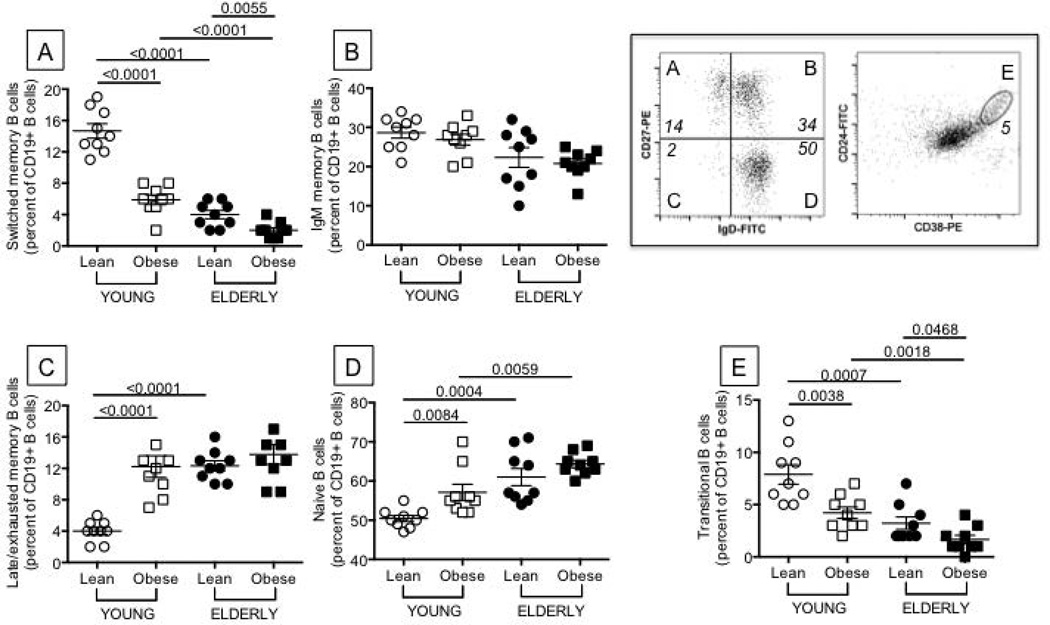
Figure 2. Obesity decreases the percentage of switched memory and transitional B cells and increases that of late/exhausted memory B cells.
One hundred µl of blood from the same individuals as in Figure 1 were stained for 20 min at room temperature with the following antibodies: anti-CD19 (BD 555415), anti-CD27 (BD 555441), and anti-IgD (BD 555778) to measure switched memory (IgD-CD27+), IgM memory (IgD+CD27+), naive (IgD+CD27−), late/exhausted memory (IgD-CD27−) B cells. Anti-CD24 (BD 555427) and anti-CD38 (BD 555460) antibodies were used to measure transitional B cells (CD24brightCD38bright). Switched memory (A) are IgD-CD27+, IgM memory (B) are IgD+CD27+, naive (C) are IgD+CD27−, late/exhausted memory (D) are IgD-CD27−, transitional B cells (E) are CD24brightCD38bright. Results are expressed as percentages of CD19+ B cells. Representative dot plots to evaluate the different subsets are shown in the top right quadrant of the Figure (both are from a lean young individual). B cell percentages and numbers are decreased by obesity in young and elderly individuals. Percentages and numbers are, respectively: 17% and 425 cells/µl (lean young), 12% and 287 cells/µl (young with obesity), 5% and 125 cells/µl (lean elderly) and 3% and 69 cells/µl (elderly with obesity). ANOVA - A: F(3,36)=35.37,p<.01, observed power=1. B: F(3,36)=0.05,p=.94, observed power=.051. C: F(3,36)=1.304,p=.26, observed power=.20. D: F(3,36)=23.19,p<.01, observed power=.997. E: F(3,36)=3.98,p=.054, observed power=.49.

