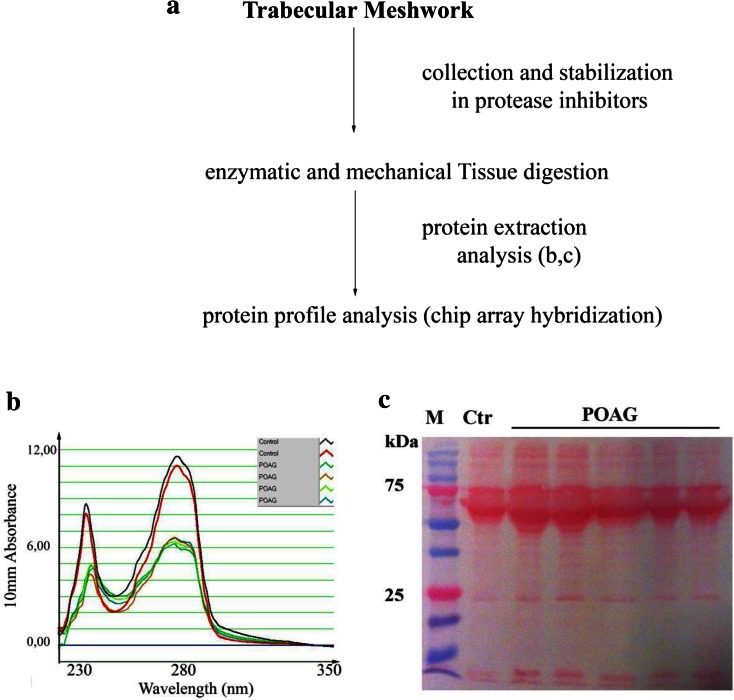
Fig. 1.
Experimental procedure and total protein analysis. a POAG and post-mortem TM specimens were simultaneously processed, according to the procedure reported in the “Methods” section. b Representative A280 plot showing the digital spectrophotometer outputs. Small peaks in the tract represent a small proportion of contaminants (solvents and salts; left side). c Comparative TM protein profiles by 1D SDS-PAGE analysis (representative membrane), from randomly selected POAG and post-mortem specimens generated after the enzymatic digestion procedure. Note the presence of bands resembling IgG proteins. POAG primary open angle glaucoma, SDS-PAGE sodium dodecyl sulphate-polyacrylamide gel electrophoresis, TM trabecular meshwork

