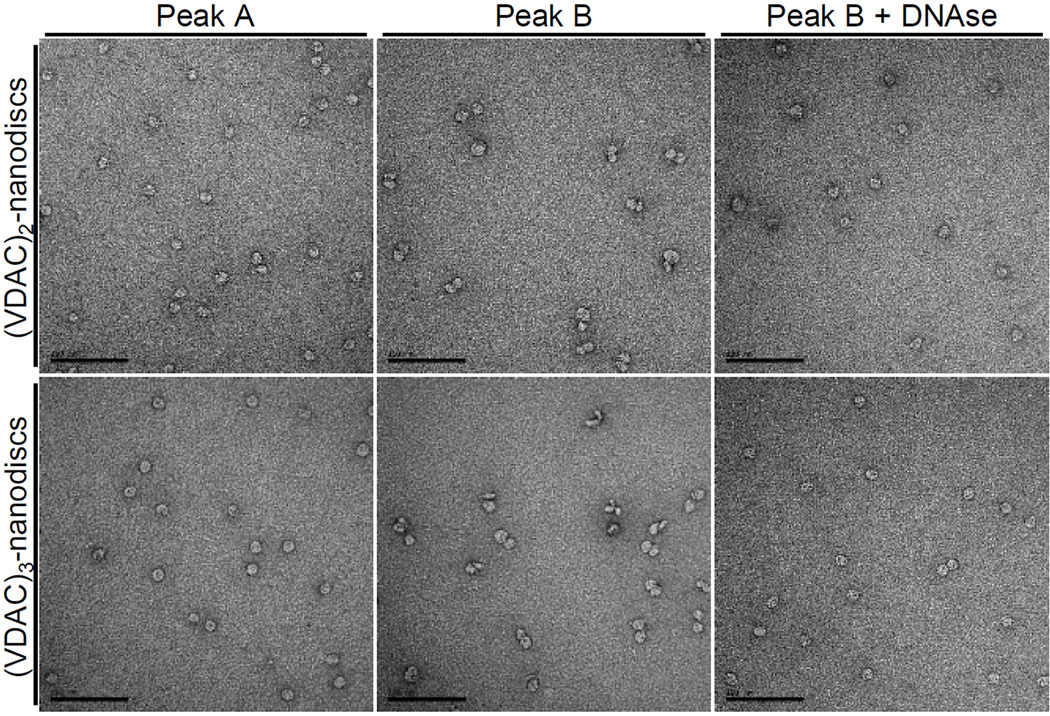
Figure 2.
Characterization of VDAC-nanodiscs by negative stain transmission electron microscopy. Representative images of SEC peak fractions for (VDAC)2- and (VDAC)3-nanodiscs before and after treatment with DNAse. A representative TEM image of the SEC peak fraction of empty nanodiscs as well as peak fraction C is shown in Supporting Figure S2. The scale bar is 100 nm.

