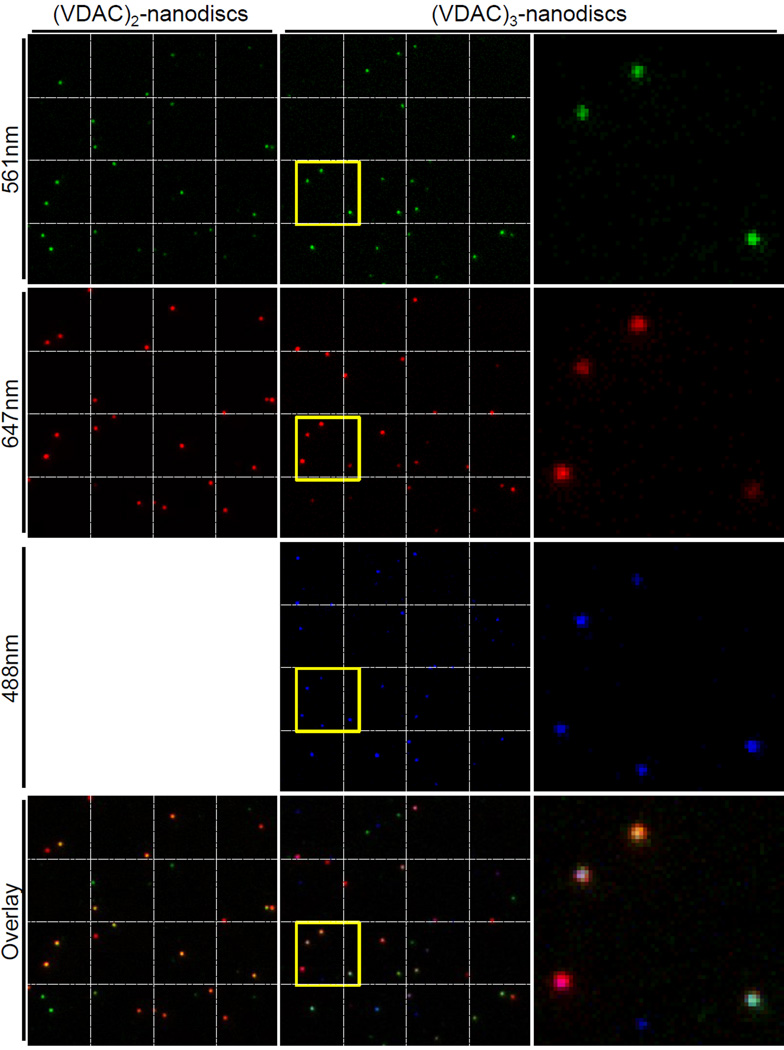
Figure 3.
Single molecule analysis of nanodisc particles by fluorescence microscopy. Representative TIRF images of (VDAC)2- and (VDAC)3-nanodiscs. Nanodiscs assembled with un-tagged VDAC (control) are shown in Supporting Figure S5. Emitted fluorescent light was recorded from the same field of view after excitation at the wavelength specified. An overlay is shown at the bottom. The area indicated with a yellow box is shown enlarged in the row on the right (dimensions 6.8 × 6.8 µm). The images have dimensions of 27.3 × 27.3 µm.

