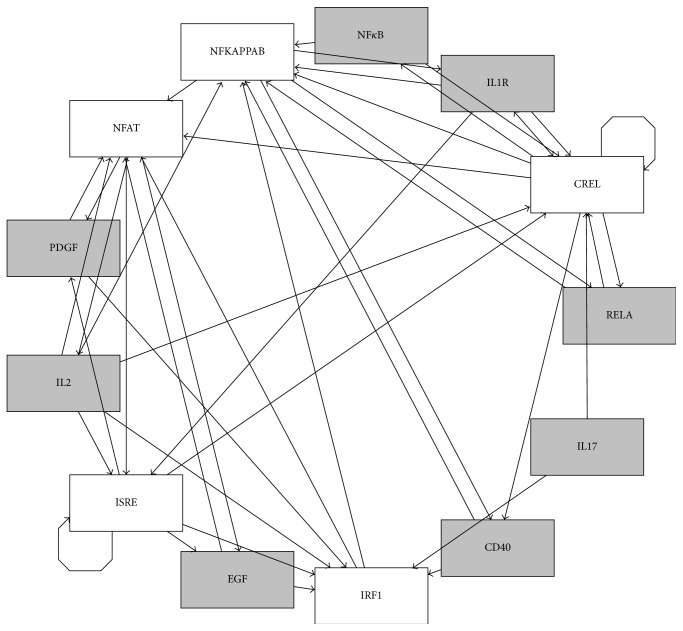
Figure 2.
The network of interactions between TFs and ligand induced signaling pathways: rectangles represent network nodes and indicate the node name in an abbreviated manner. Terminating black arrows on an edge indicate causality but the sign of the effects (activation or inhibition) is unknown. Grey nodes represent signaling pathways and white nodes represent TFs.

