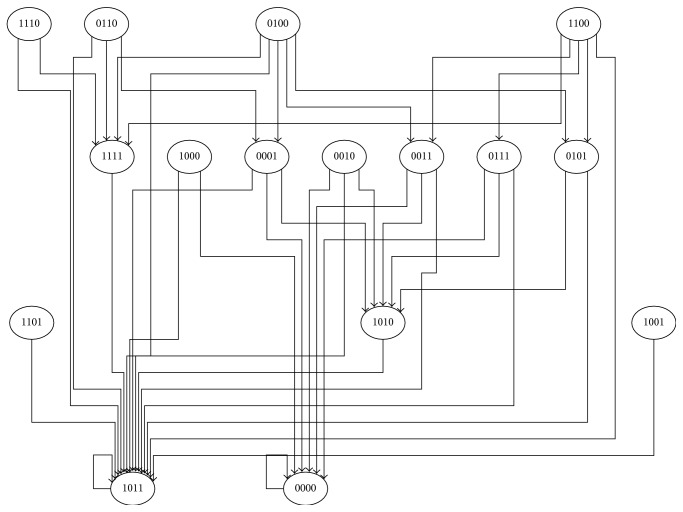
Figure 6.
State-transition map of minimum functional network: attractor analysis of the minimal functional network reveals the transition from one state of the system (depicted by a node) to another state which is connected by an edge. The state of the system is defined by the states of each node in the minimal functional network which are depicted inside the nodes of the state-transition map. Particularly, 1/0 depicts the states of the nodes in the following order: c-REL, NFκB, and PDGF pathways and IL1 pathway.

