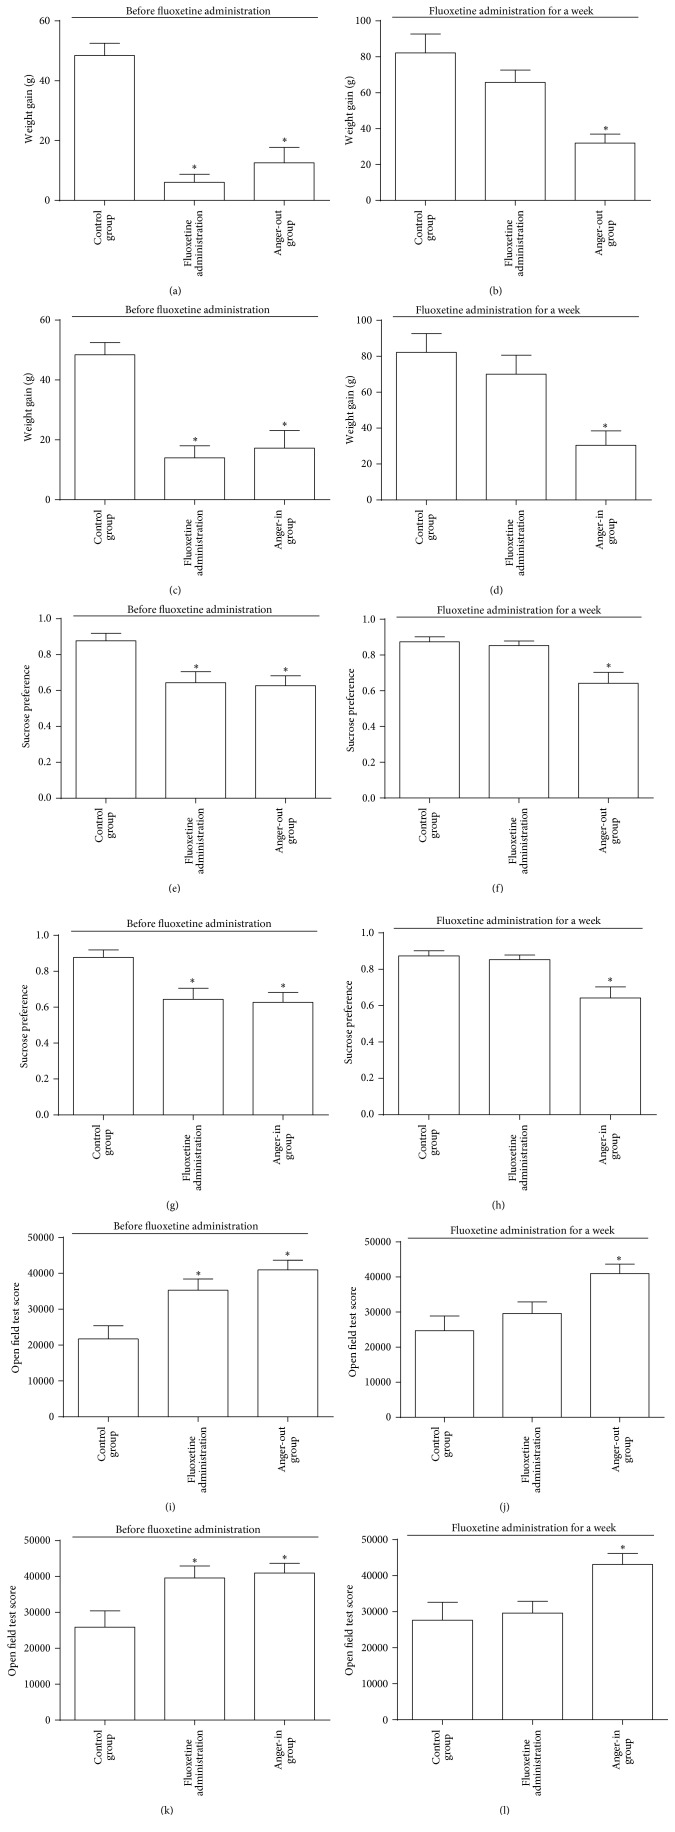
Figure 2.
Quantitative analysis (n = 12) in weight gain (a, b, c, d), sucrose preference (e, f, g, h), and open field test (i, j, k, l) of anger-out (a, b, e, f, i, j) and anger-in (c, d, g, h, k, l) groups before (a, c, e, g, i, k) and after (b, d, f, h, j, l) fluoxetine administration (∗ P < 0.05).

