
Fig. 2.
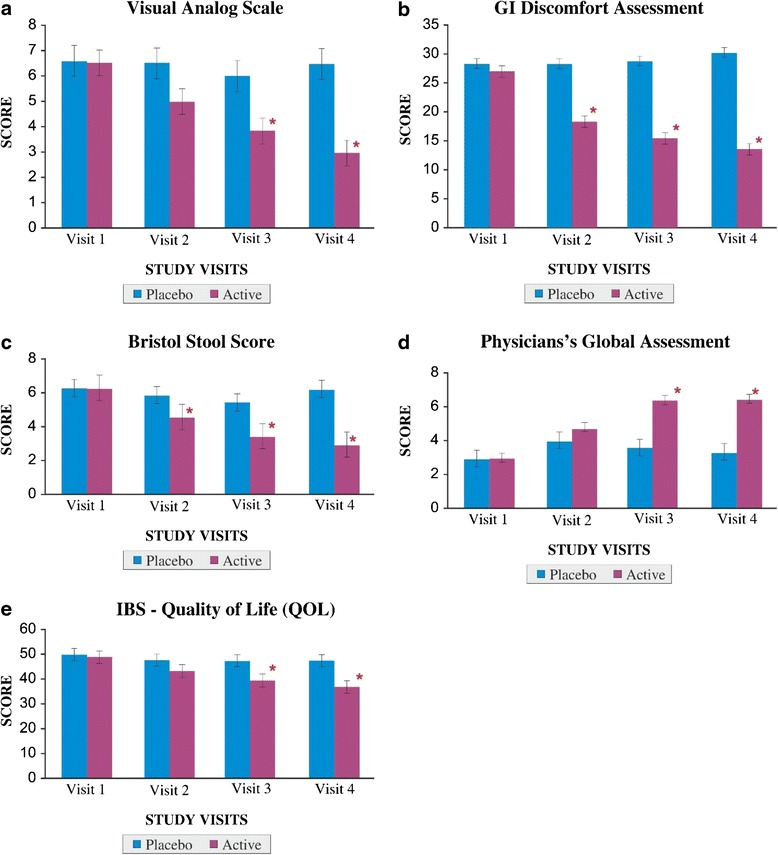
a Visual analog scale for abdominal pain. Legend: A value of ‘0’ indicates ‘no pain’ while ‘10’ indicates ‘worst possible pain’. *p < 0.01 between placebo and active groups on visit 3 and 4. b GI discomfort assessment for IBS symptoms. Legend: Low value indicates less GI discomfortness. *p < 0.01 between placebo and active groups from visits 2 to 4. c Bristol stool score for stool frequency. Legend: High value indicates diarrhea where the stool is ‘watery, with no solid pieces. *p < 0.01 between placebo and active groups from visits 2 to 4. d Physician’s global assessment for disease severity. Legend: Scale ranges from 0 to 10, where 0 indicates ‘very poor’ and 10 indicates ‘excellent’. *p < 0.01 between placebo and active groups on visits 3 and 4. e IBS –QOL. Legend: High QOL value indicates poor quality of life. *p < 0.01 between placebo and active groups on visits 3 and 4. All the values are expressed as mean ± S.E