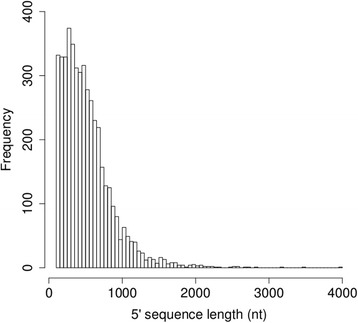
Fig. 5.

Frequency distribution of contigs containing the 5´upstream region of the gene models generated. The sequence length recovered is expressed in nucleotides. The distribution was built using the contigs containing the first exon where the amino acid 10 or previous is present and where from the beginning of the first exon have at least 100 nt upstream.
