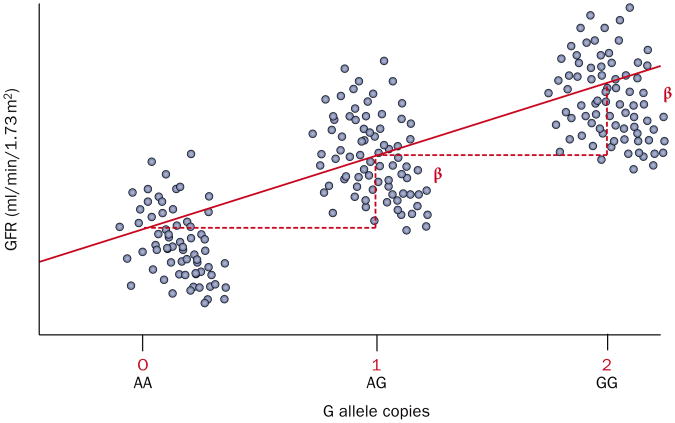
Figure 1.
An additive genetic model for GFR. In this additive model, each copy of the G allele is associated with an increase in GFR. The β-coefficient (β) indicates the unit increase in GFR (a continuous trait) per copy of the G allele. The blue circles represent individual GFR estimates for individuals with the genotype indicated on the x-axis. The red line indicates the regression slope of GFR on genotype. Abbreviation: GFR, glomerular filtration rate.

