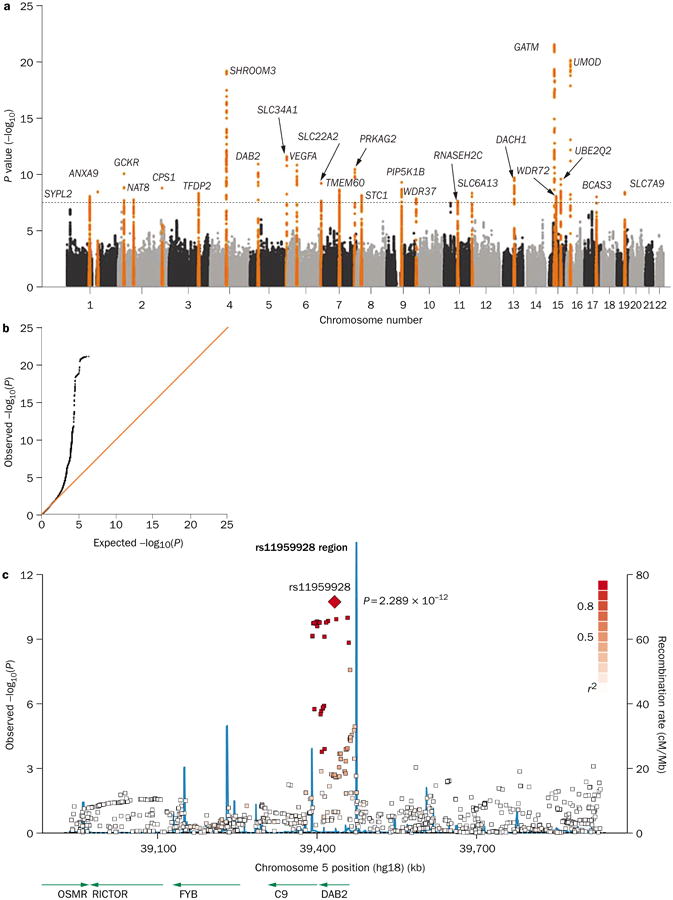
Figure 2.

Graphical presentation of results from a GWAS of eGFR. a | A Manhattan plot showing significance level for each of the SNPs tested. SNP locations on the plot reflect their position across the 23 human chromosomes. SNPs with P values below 5.0 × 10⁻⁸ are colored orange. Regions with multiple significant SNPs are labeled by the likely disease-related gene. b | A quantile–quantile (Q–Q) plot detects systematic bias in a GWAS. Observed and expected P values are plotted for each SNP, ordered from the lowest to the highest level of significance. Under the null distribution, where there are no significant associations, the Q–Q plot will lie along the 45° line. Extremely small P values deviate from this line at the right-hand tail of the distribution. c | A regional association plot shows a close-up of one association peak from the Manhattan plot. The lead SNP is labeled, with other SNPs in the region color-coded based on the degree of linkage disequilibrium with the lead SNP. The blue lines illustrate the inferred local rate of recombination across the region. Recombination hotspots are indicated by peaks in the blue lines, with SNPs lying between these hotspots being strongly correlated with each other in several haplotypes. Abbreviations: eGFR, estimated glomerular filtration rate; GWAS, genome-wide association study; SNP, single nucleotide polymorphism. Permission obtained from Nature Publishing Group © Köttgen, A. et al. Nat. Genet. 42, 376–384 (2010).
