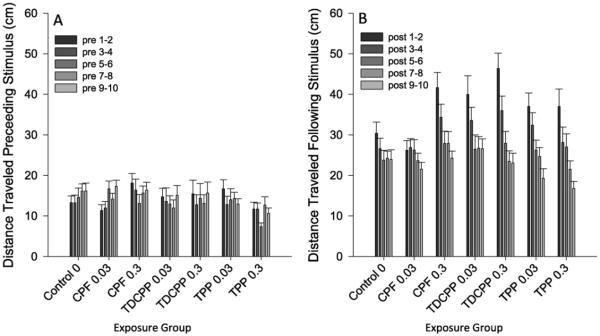
Fig. 3.
Startle Habituation Assay. Panel A plots the total distance traveled in the 5″ following delivery of the tap (startle) stimulus for each exposure group for each bin of two stimulus presentations. Panel B plots the total distance traveled in the 5″ preceding delivery of the tap stimulus for each exposure group for each bin of two stimulus presentations. Error bars represent SEM.

